Abstract. Six published zebrafish RNA-seq libraries (GSE142440; camptothecin versus DMSO in
28 hpf embryos) were processed end-to-end in Haritica — alignment, gene-level quantification, and
differential expression — and the resulting count matrix was independently re-analysed with the original
R/Bioconductor DESeq2. Across 22,388 tested genes, log2 fold-changes from the two implementations
are collinear (Pearson r = 1.000) and 98.7% of significant calls agree (Jaccard 0.987;
5,230 shared). The direction reported for the source experiment — predominant down-regulation under
camptothecin — is reproduced (down-regulated fraction 0.683 versus 0.681 in R). Haritica's pyDESeq2
engine is statistically equivalent to R DESeq2 on identical input.
1Data and methods
The dataset (GSE142440 / PRJNA597022) comprises three wild-type DMSO controls (SRR10747725–727) and
three camptothecin-treated samples (SRR10747728–730): single-end Ion Torrent reads from 28 hpf
Danio rerio embryos. Within Haritica, reads were aligned to Ensembl GRCz11 (release 110) with
minimap2, quantified to gene-level counts with featureCounts, and tested for differential expression with
pyDESeq2 (Wald test, Benjamini–Hochberg FDR), retaining genes with at least ten total reads
(22,388 genes). A gene was called differentially expressed at adjusted p < 0.05 and
|log2 fold-change| > 1.
Table 1. Analysis parameters for the Haritica run.
Parameter
Value
Design
~ condition (control = DMSO; contrast CPT / DMSO)
Aligner
minimap2 (GRCz11, Ensembl 110)
Quantification
featureCounts, gene level
DE method
pyDESeq2 — median-of-ratios, negative-binomial GLM, Wald test
Multiple testing
Benjamini–Hochberg
Filter / threshold
≥10 reads; adjusted p < 0.05, |log2FC| > 1
Genes tested
22,388
1.1 The reference
The reference is the original R/Bioconductor DESeq2 (Love et al., 2014 [1]), run on Haritica's own
count matrix — the identical counts supplied to pyDESeq2 — by the script
reference_deseq2.R, which calls the package and adds no statistics of
its own. The comparison therefore isolates the differential-expression engine from alignment and annotation.
pyDESeq2 [2] implements the same estimator (median-of-ratios normalization, a negative-binomial generalized
linear model, the Wald test, and Benjamini–Hochberg correction), so on identical input the two are
expected to agree to numerical precision.
2Results
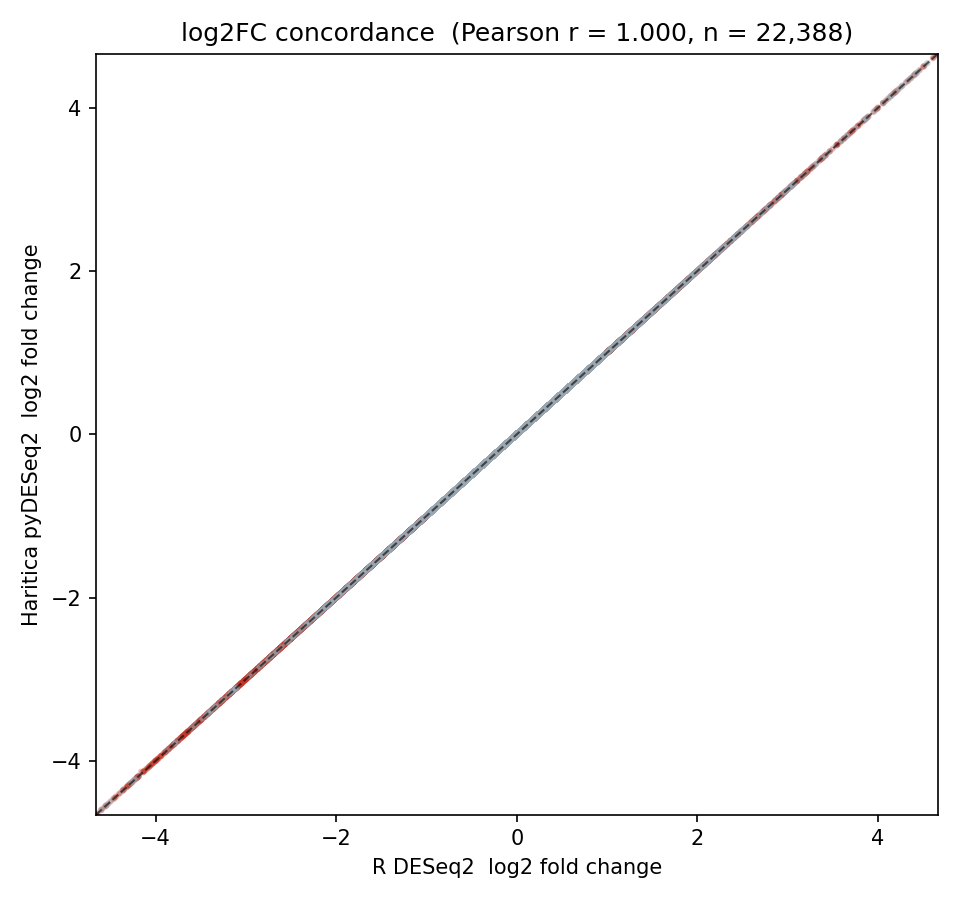
Across all 22,388 tested genes, log2 fold-changes from the two implementations are collinear
(Pearson r = 1.000, Spearman ρ = 1.000; Figure 1), and −log10
adjusted p-values correlate at r = 0.9985 (Table 3). At the significance threshold
the engines call 5,238 (Haritica) and 5,289 (R) genes differentially expressed (Table 2) and share 5,230
(Jaccard 0.987; Table 3); the 67 discordant calls all lie on the threshold boundary. The absolute count differs
from the 2,894 differentially-expressed genes reported in the source publication because this run uses the
Ensembl GRCz11 gene model and minimap2 rather than the original annotation and aligner; the direction
— predominant down-regulation under camptothecin — is reproduced (Figures 2–5).
Table 2. Per-implementation values: Haritica (pyDESeq2) and R/Bioconductor DESeq2 on the identical count matrix.
Quantity
R DESeq2
Haritica
Genes tested
22,388
22,388
Differentially expressed
5,289
5,238
up / down
1,689 / 3,600
1,661 / 3,577
Down-regulated fraction
0.681
0.683
Published anchor (direction)
671 up / 2,223 down (fraction 0.768)
Table 3. Agreement between Haritica and R/Bioconductor DESeq2.
Metric
Value
log2FC Pearson r
1.000
log2FC Spearman ρ
1.000
−log10(adj. p) Pearson r
0.9985
DE-call agreement (Jaccard)
0.987
Figure 1. Per-gene log2 fold-change concordance. Each point is one
gene: Haritica pyDESeq2 (horizontal) versus R/Bioconductor DESeq2 (vertical). Pearson r = 1.000
(n = 22,388).
Haritica
R DESeq2 — reference
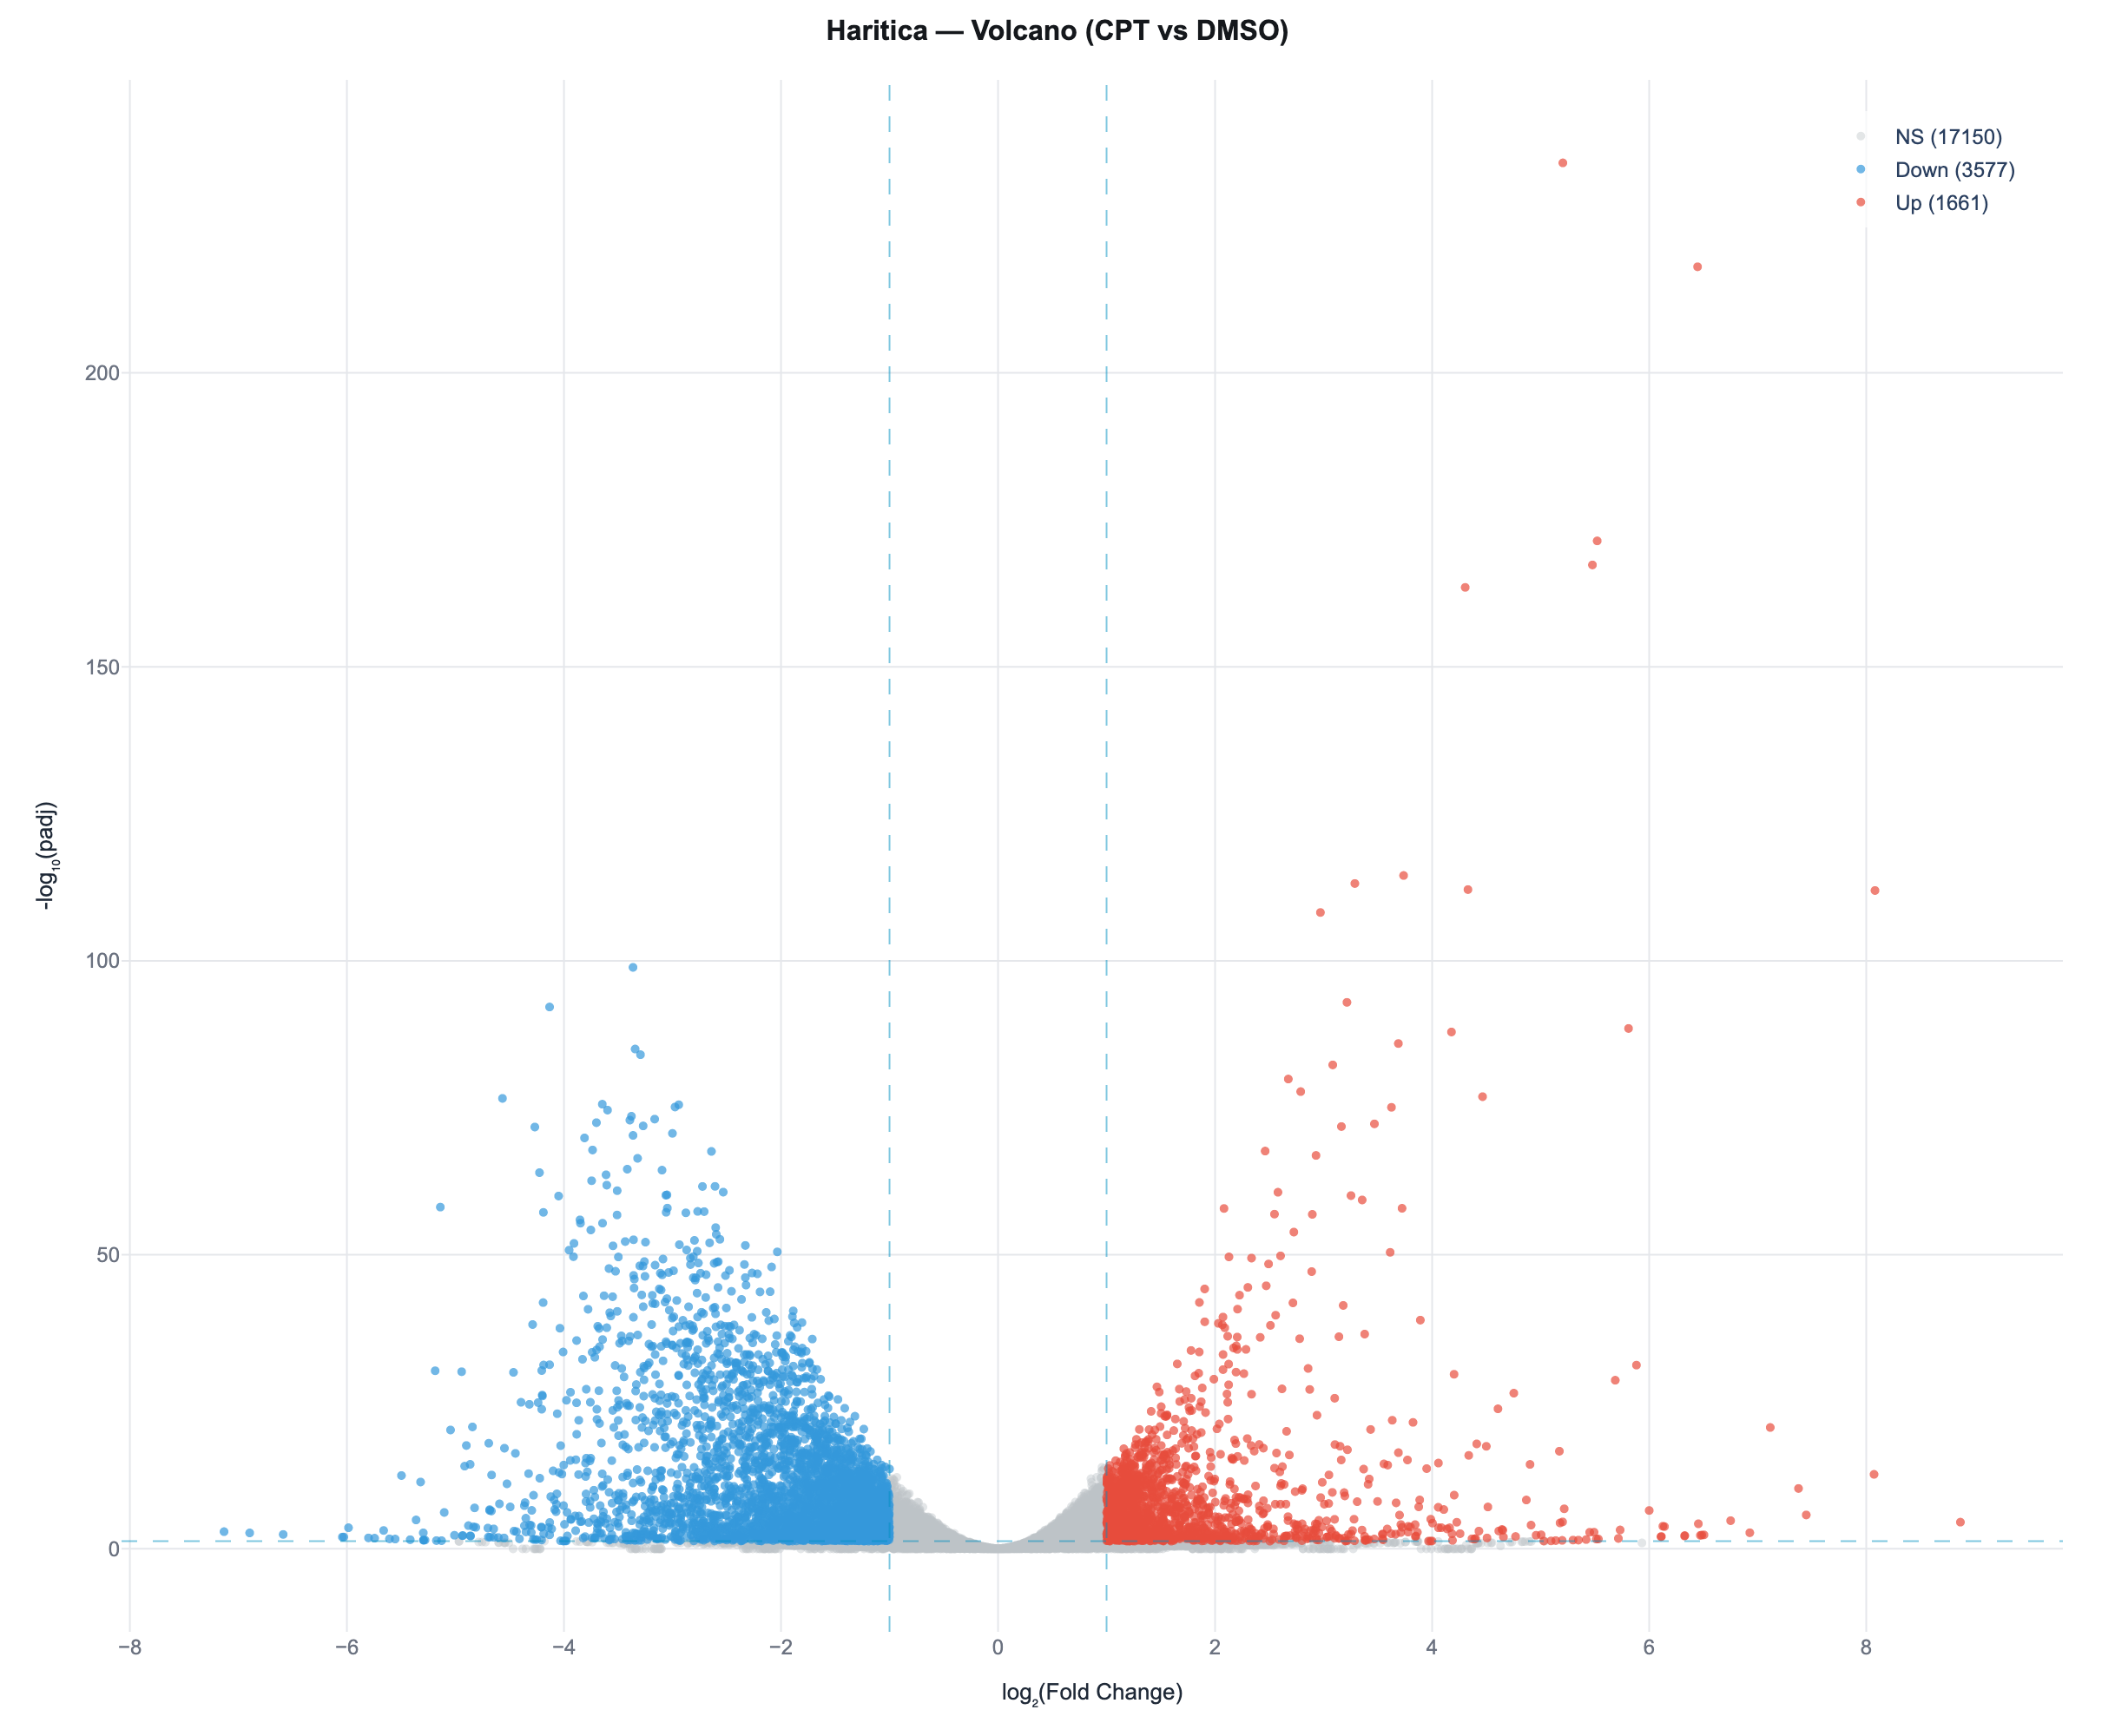
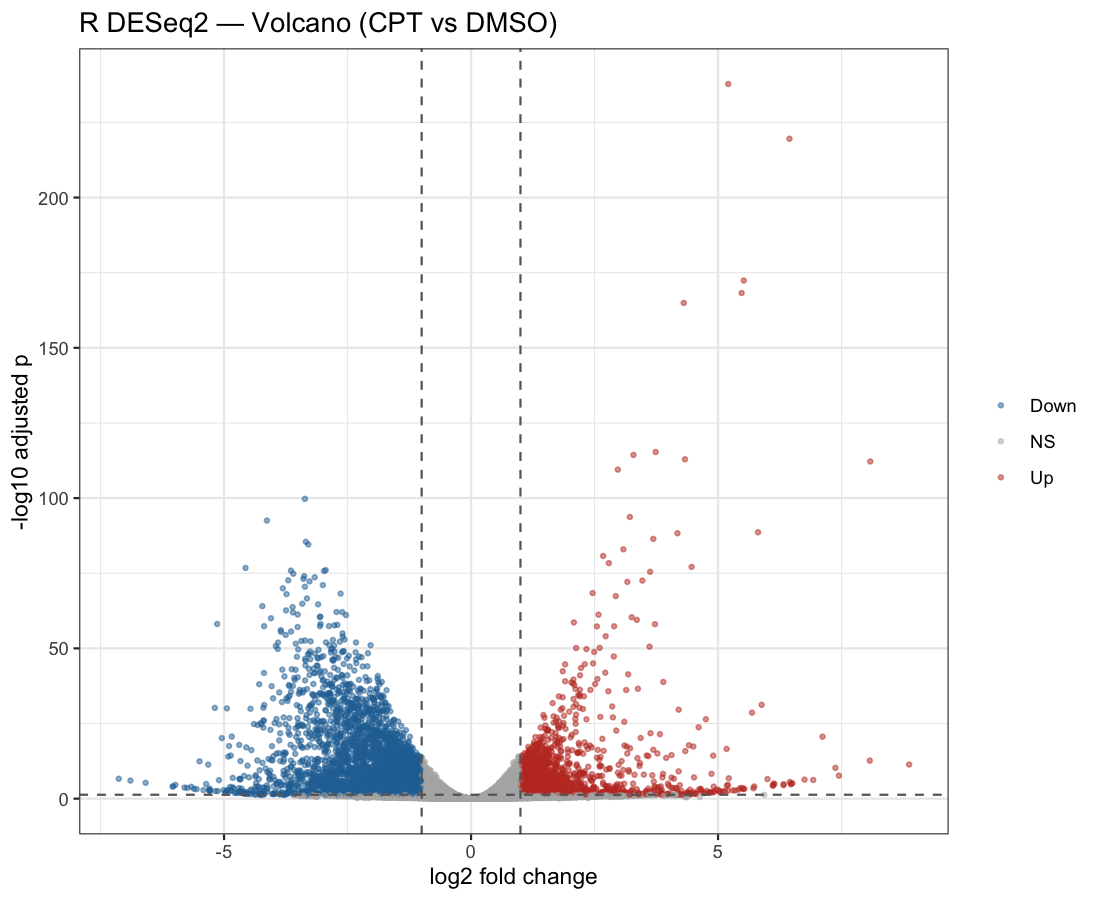
Figure 2. Volcano plot. Non-significant 17,150; down-regulated 3,577;
up-regulated 1,661. Both show the same fold-change/significance structure and a denser down-regulated lobe.
Haritica
R DESeq2 — reference
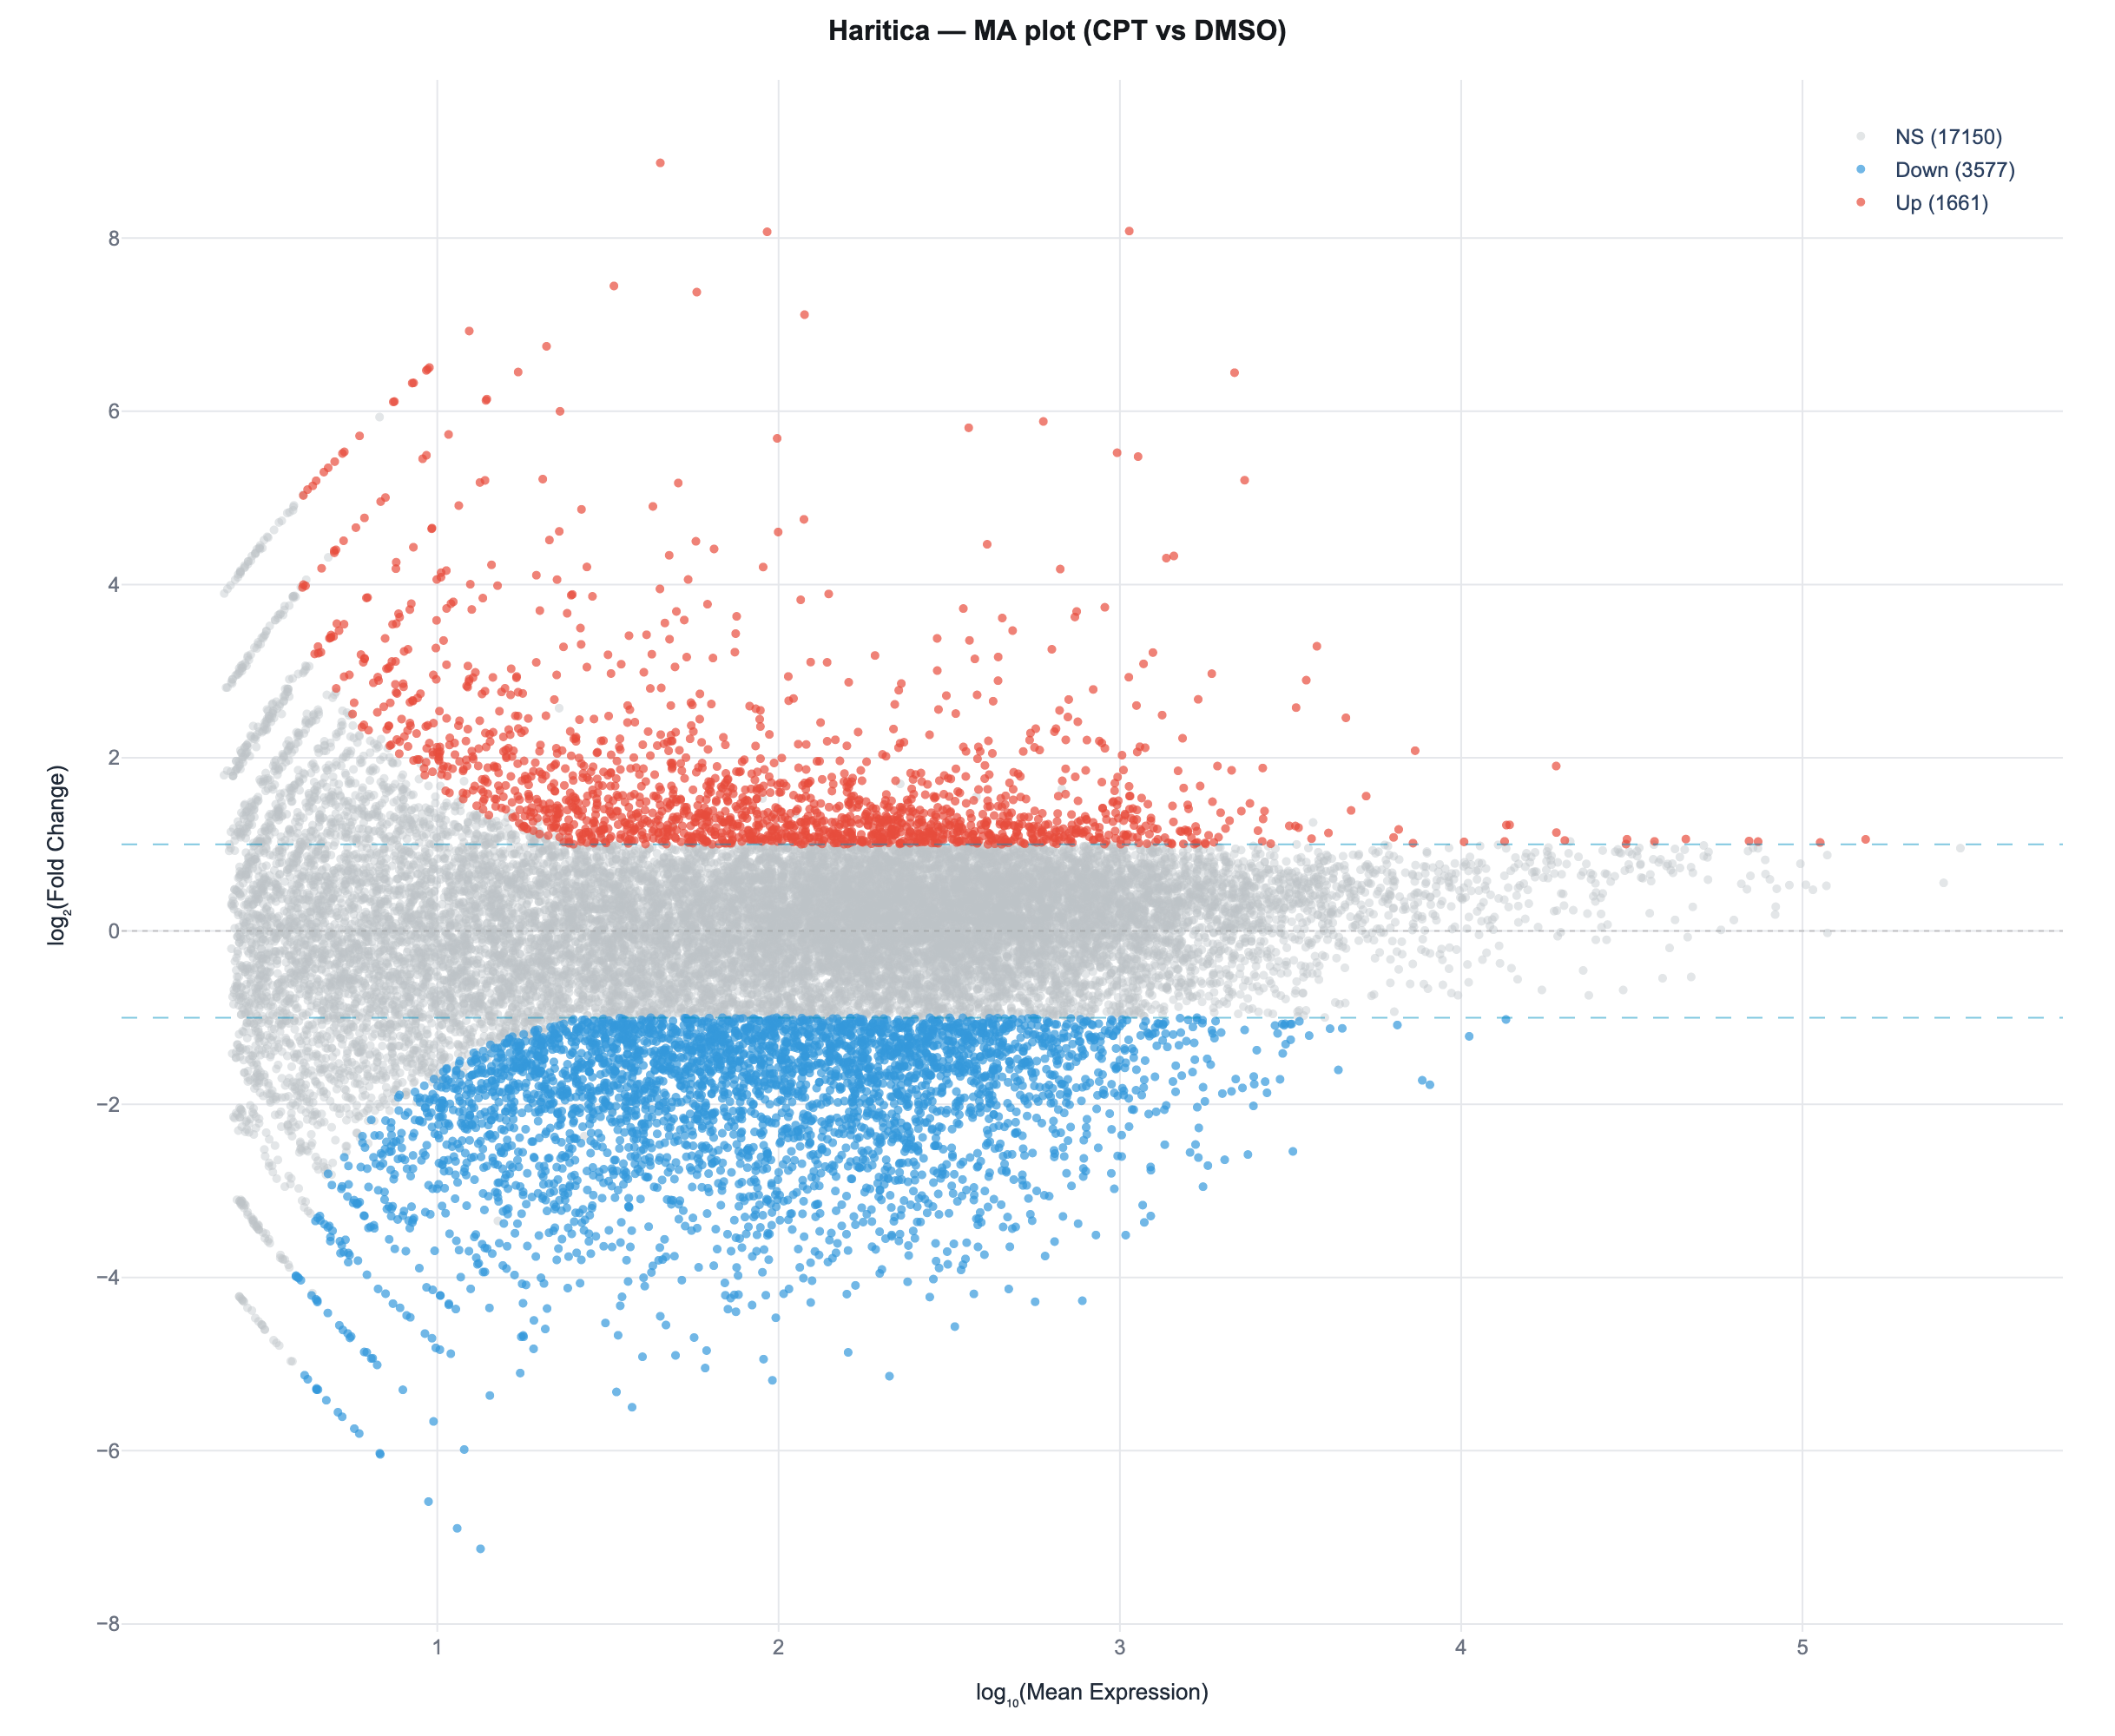
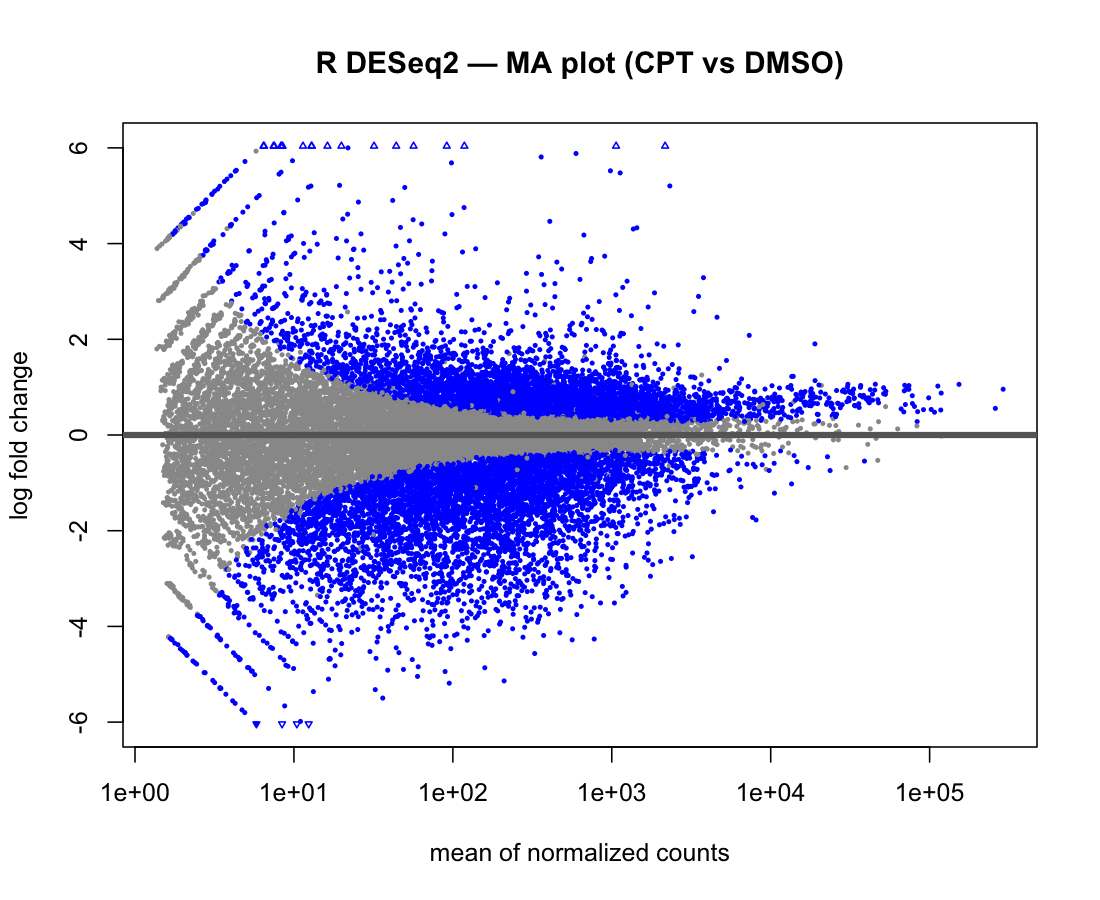
Figure 3. MA plot: log2 fold-change versus mean expression.
The two implementations share the same trumpet shape and down-regulation skew.
Haritica
R DESeq2 — reference
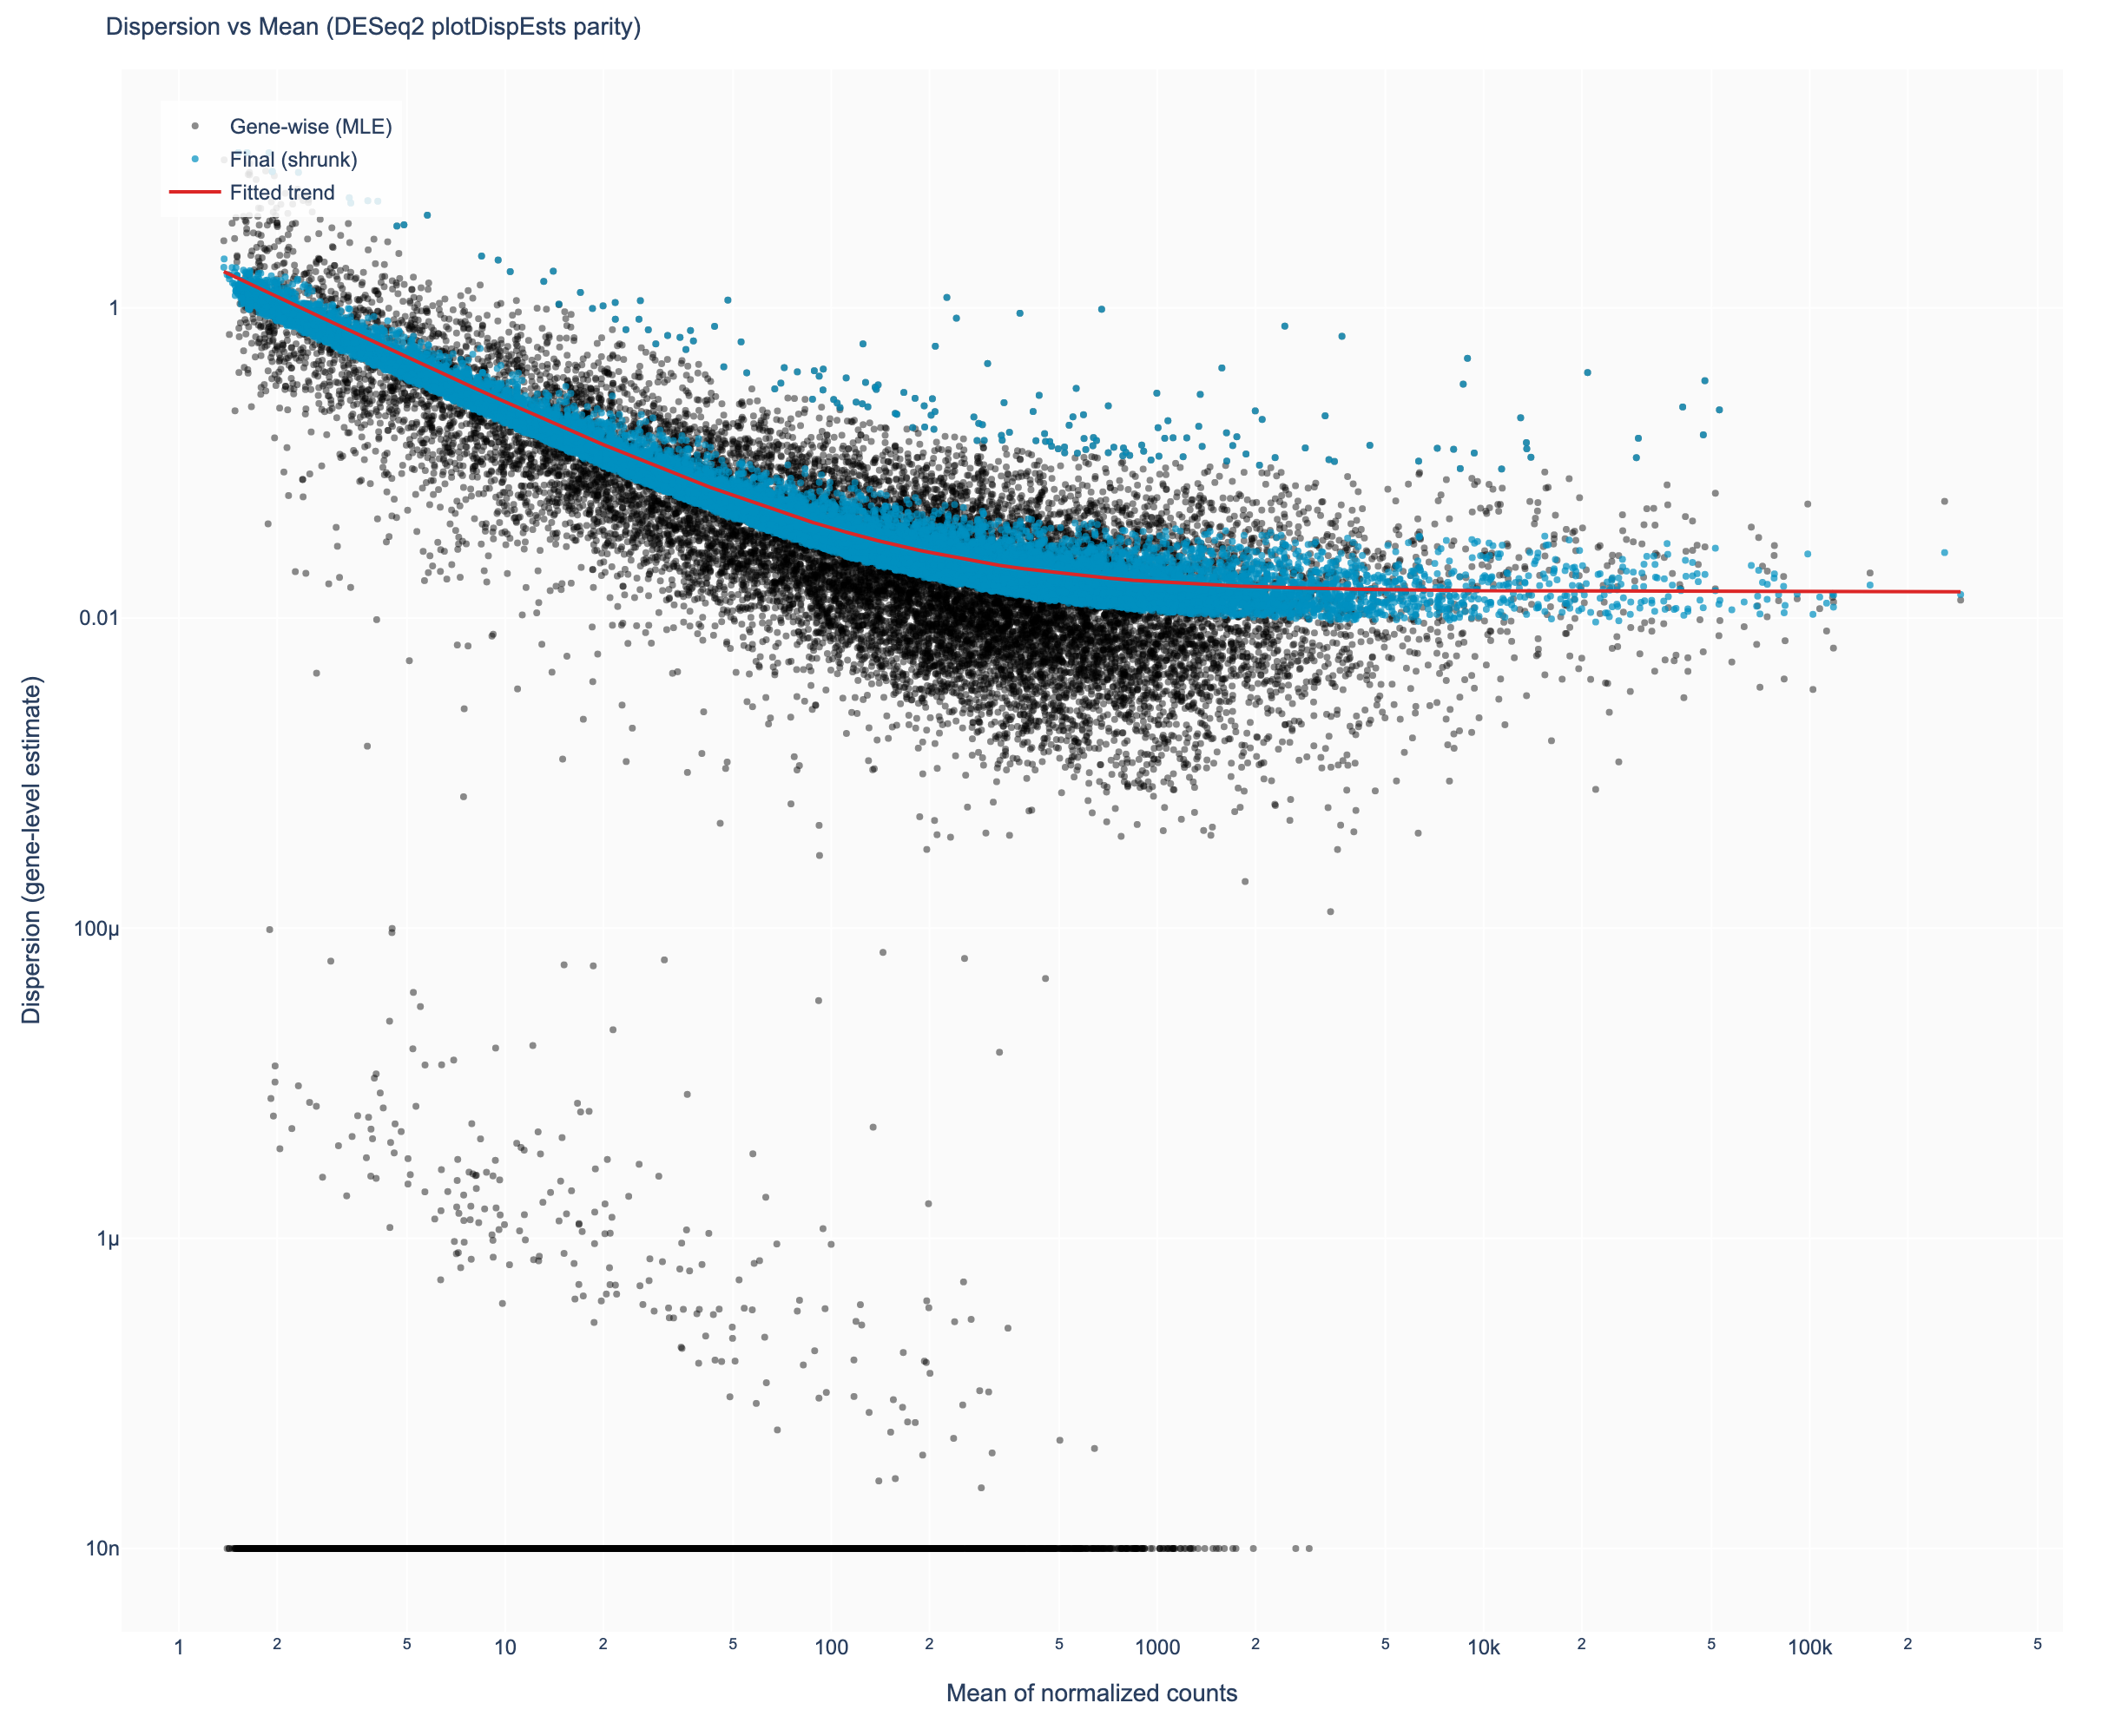
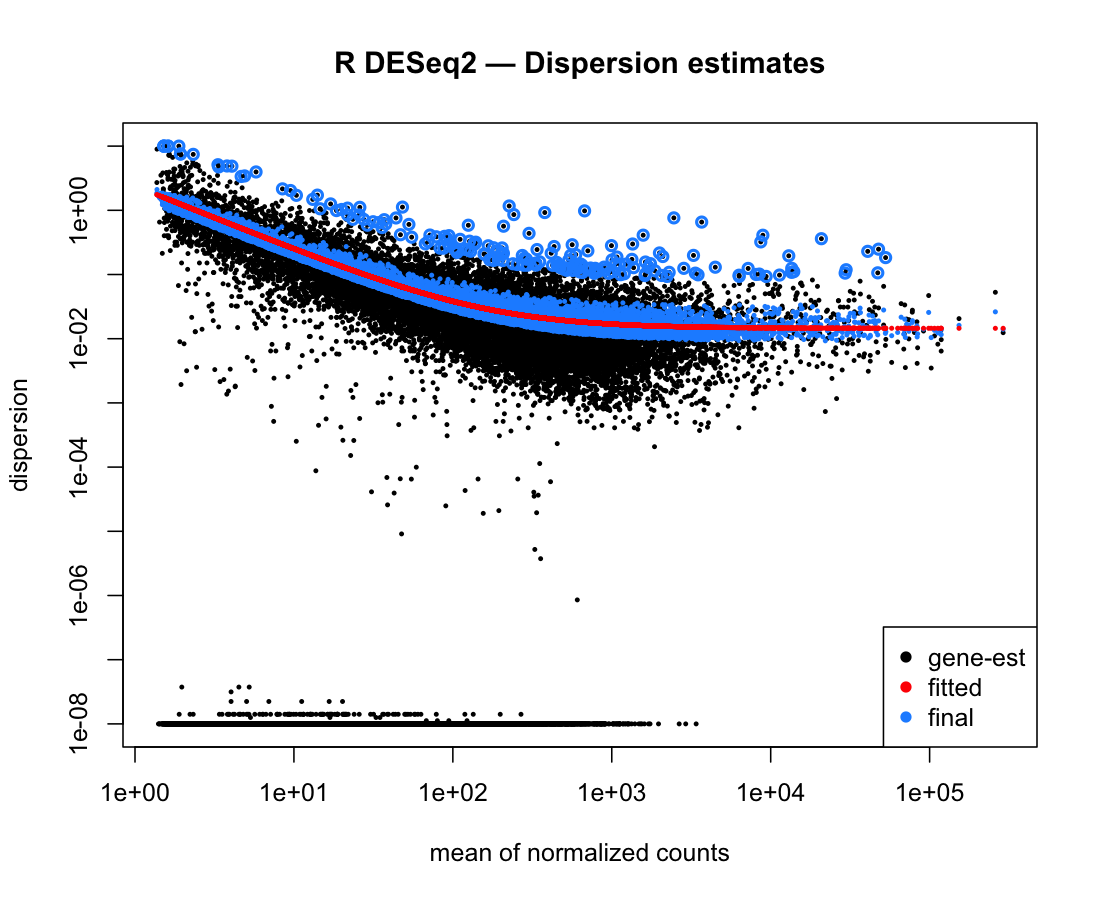
Figure 4. Dispersion estimates: gene-wise maximum-likelihood estimates
(black), the fitted trend (red), and the empirical-Bayes-shrunk final values (blue), matching DESeq2's
plotDispEsts.
Haritica
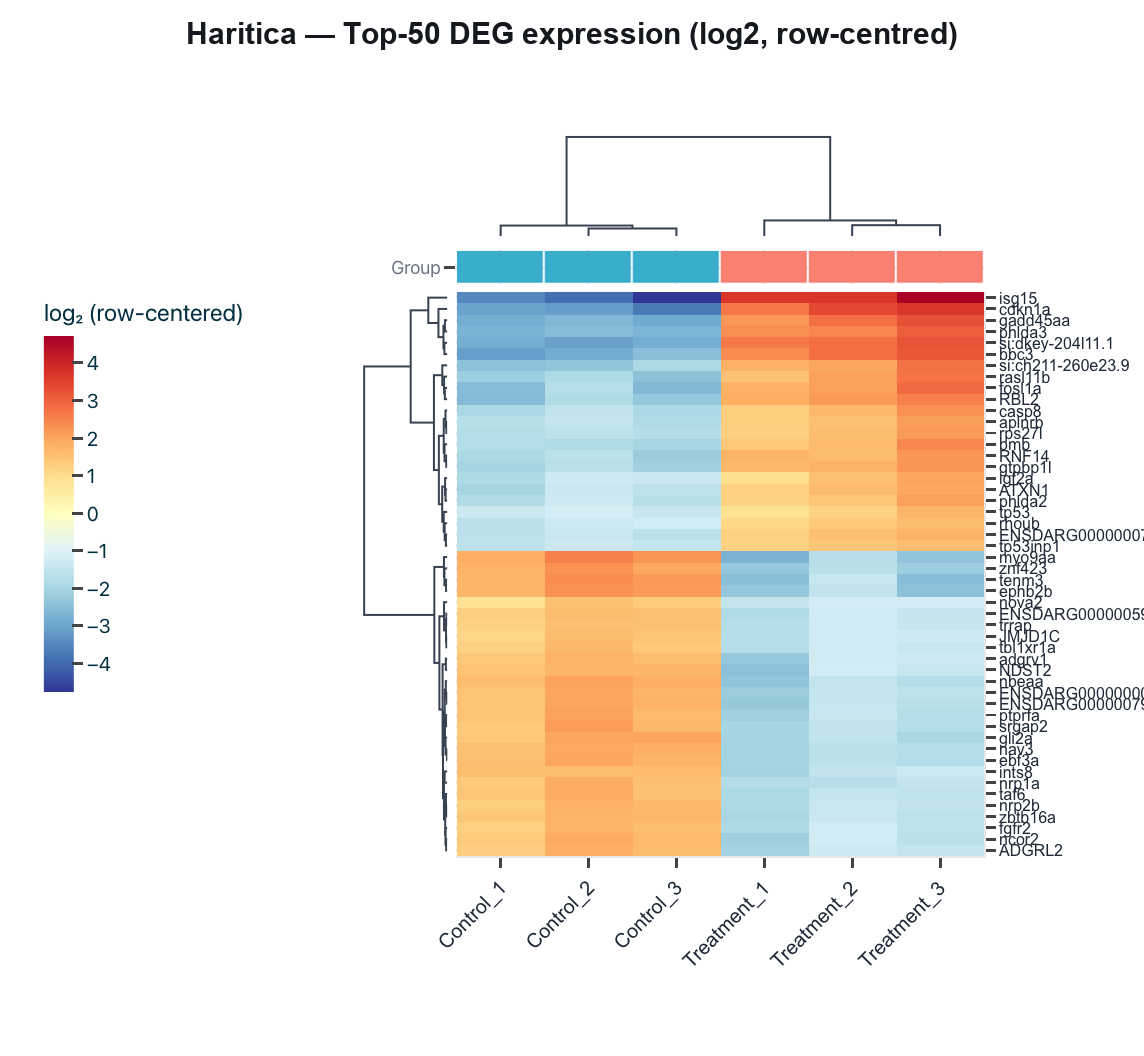
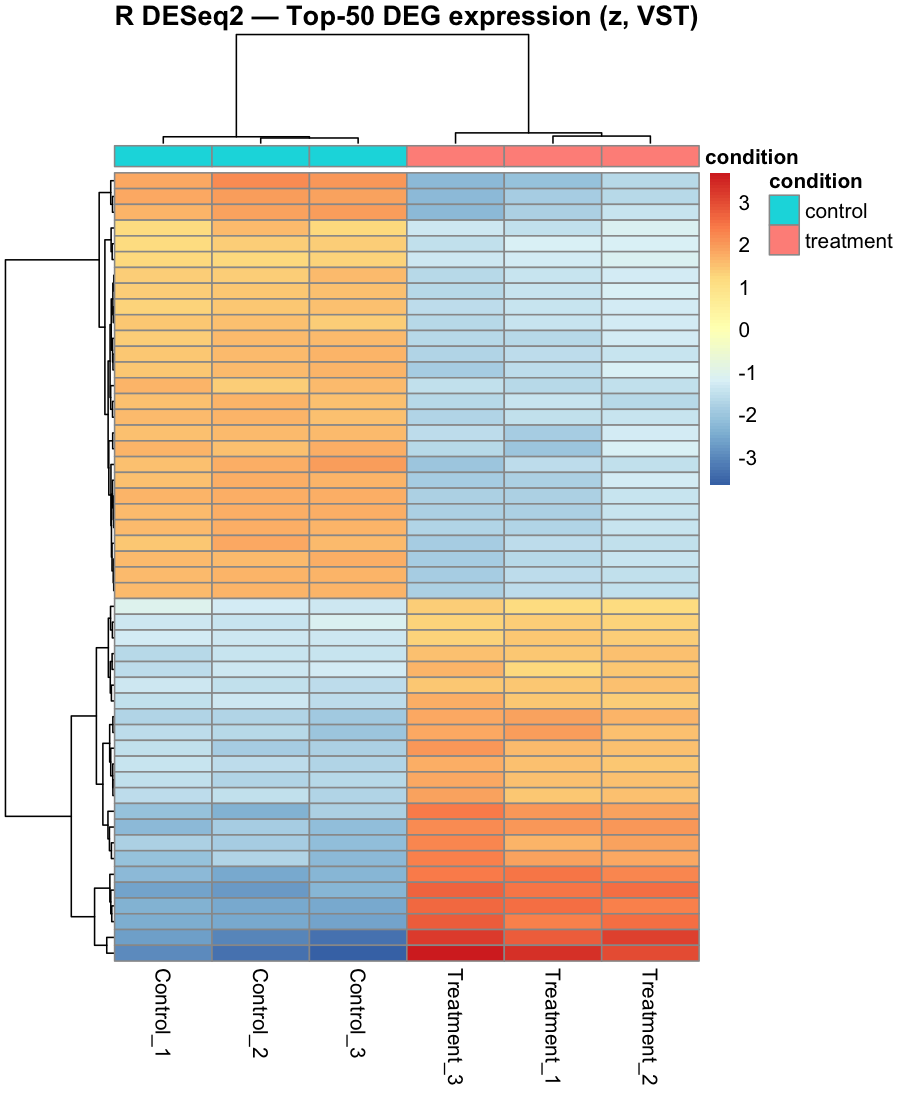
R — reference (pheatmap)
Figure 5. Top-50 differentially-expressed genes: row-centred log2
expression with complete-linkage clustering and a condition annotation. Replicates cluster by group, and the
up-regulated block corresponds to the canonical camptothecin p53 / DNA-damage response (cdkn1a,
bbc3, gadd45aa, tp53, tp53inp1).
3Data availability and references
All inputs are public. Raw reads: GEO series
GSE142440 / BioProject
PRJNA597022, runs
SRR10747725–730
(ENA). Reference genome: Ensembl zebrafish GRCz11 (release 110). The independent reference result is
generated by reference_deseq2.R and the concordance metrics by
concordance.py.
Love MI, Huber W, Anders S. Moderated estimation of fold change and dispersion for RNA-seq data with DESeq2. Genome Biology 2014;15:550.
Muzellec B, Teleńczuk M, Cabeli V, Andreux M. PyDESeq2: a python package for bulk RNA-seq differential expression analysis. Bioinformatics 2023;39(9):btad547.