Bioinformatics
without the code.
Haritica replaces R and the command line with a point-and-click desktop app — from raw FASTQ to publication-ready figures. And every analysis is validated against the field's reference tools.
macOS · Windows · Linux · 14-day free trial, no credit card
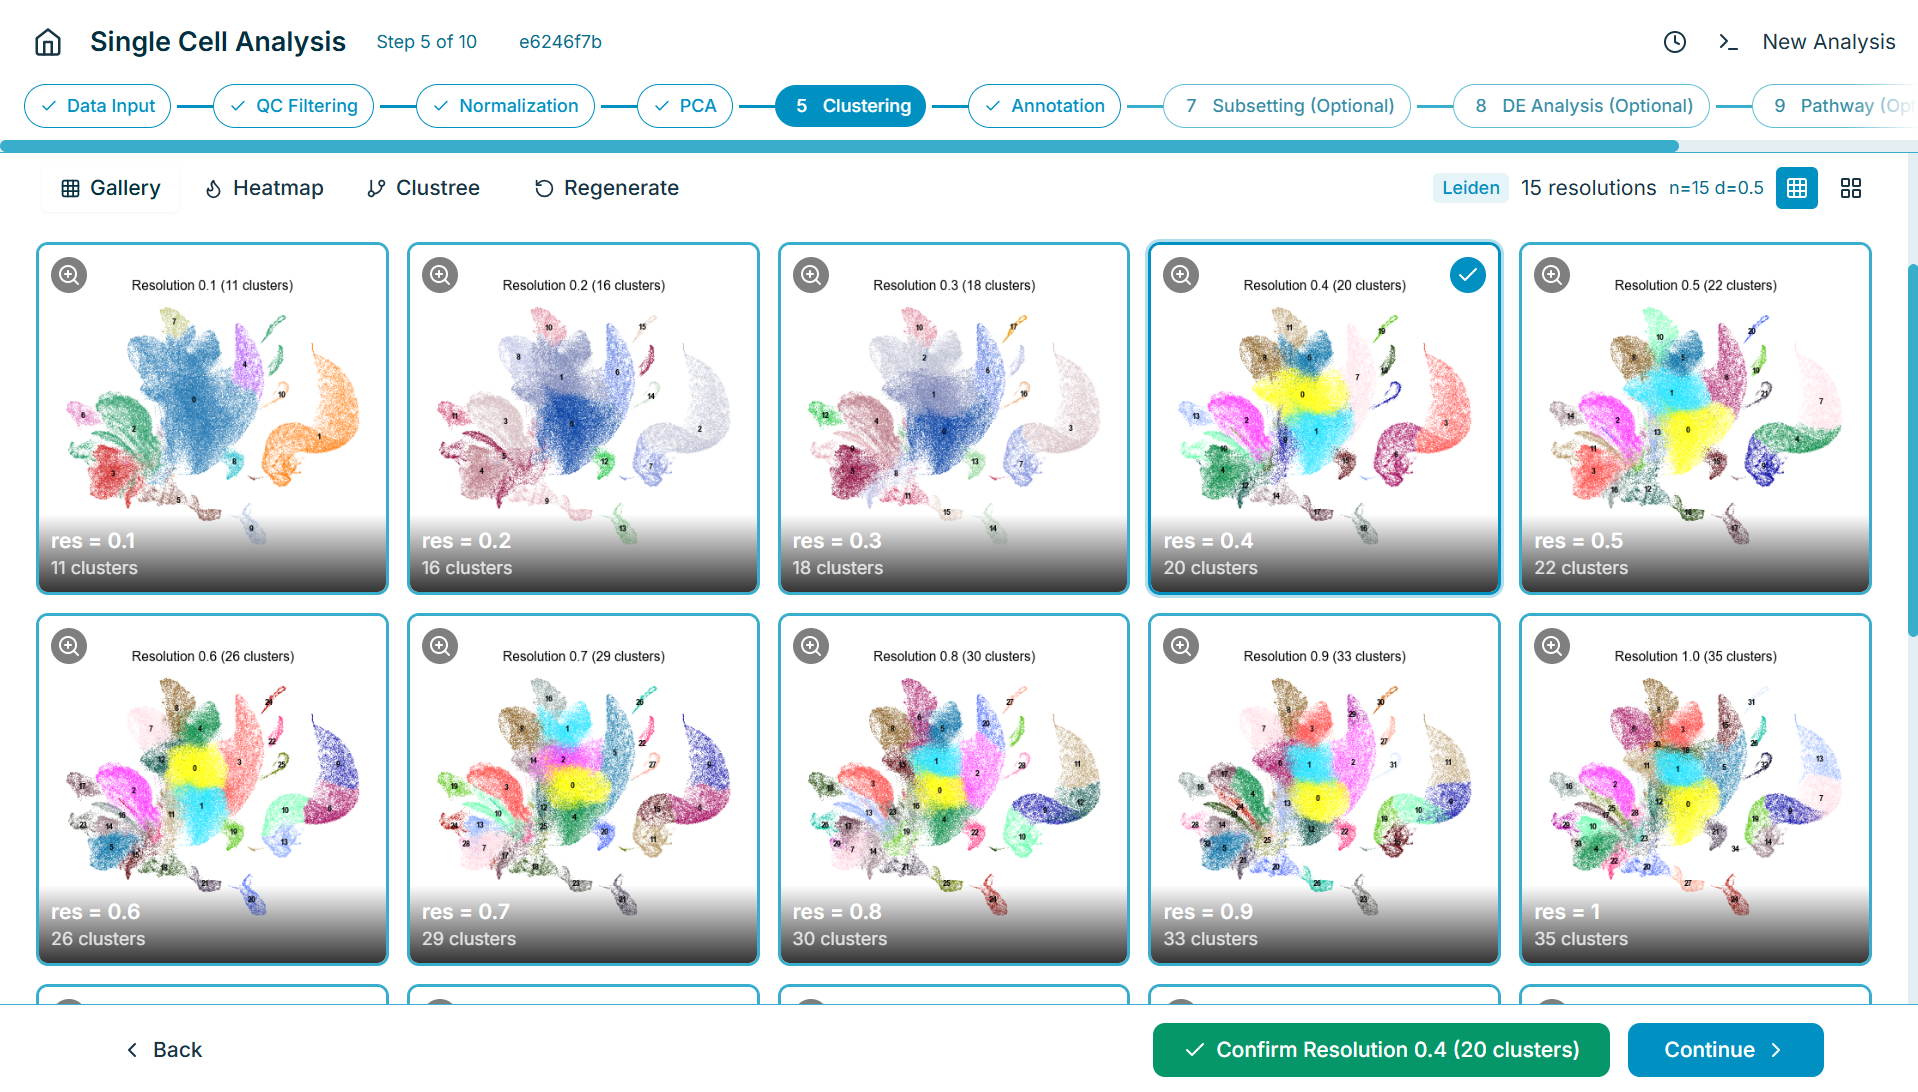
Single-cell UMAP with cluster annotation · rendered in-app
We don't ask you to trust us.
We show the receipts.
Every Haritica analysis reproduces the result of an independent, peer-reviewed reference on identical public data.
Read the validation libraryvs R/Bioconductor DESeq2
vs clusterProfiler
vs NIST GIAB · bcftools
vs 10x CellRanger
vs R WGCNA
Every analysis. One interface.
From raw sequencing reads to publication-ready figures — without leaving the app, and without writing a line of R.
From FASTQ to figures
in three steps.
No conda. No module load. No PATH. The aligner, indexes and reference annotation all ship inside the app.
Drop your FASTQ files.
Start from any format — FASTQ, BAM, or a CSV count matrix. Drag, drop, done.
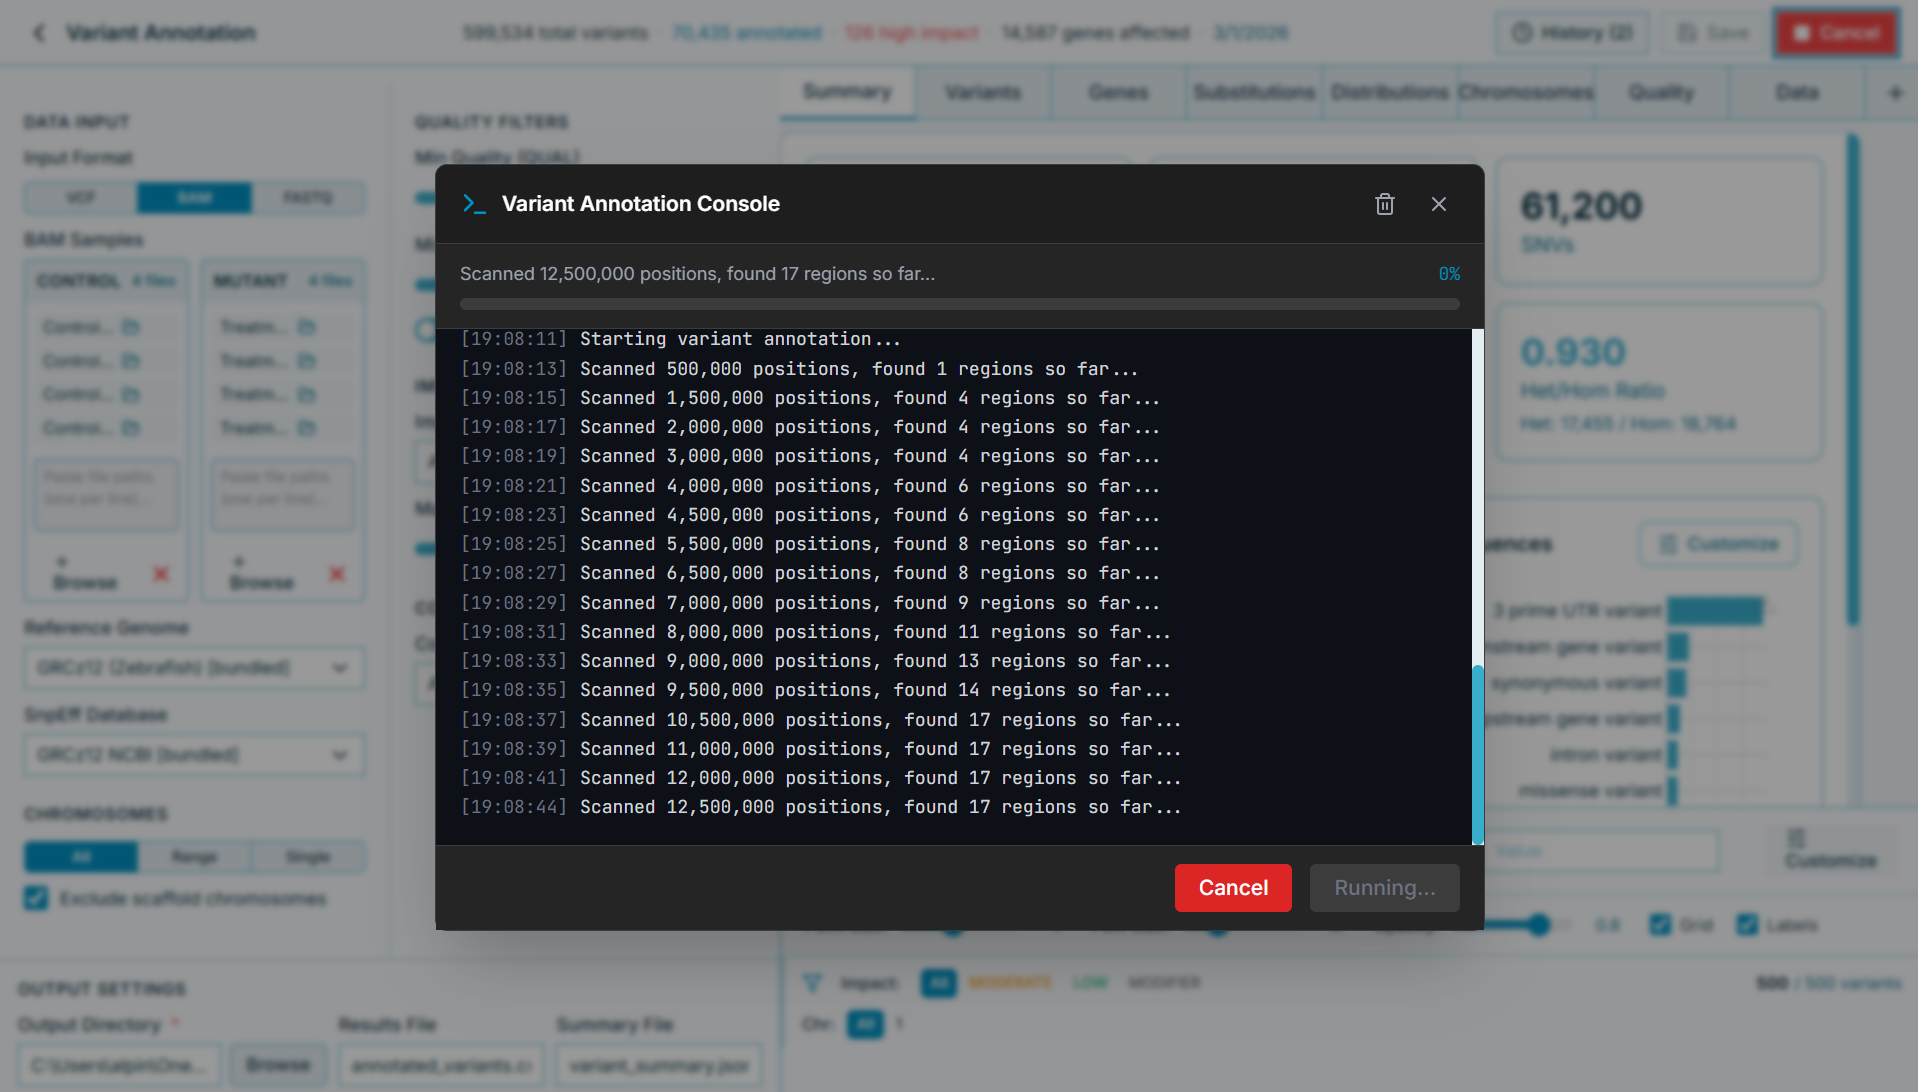
Haritica handles alignment.
Bundled HISAT2 aligns your reads automatically. Watch progress in real time — no terminal needed.
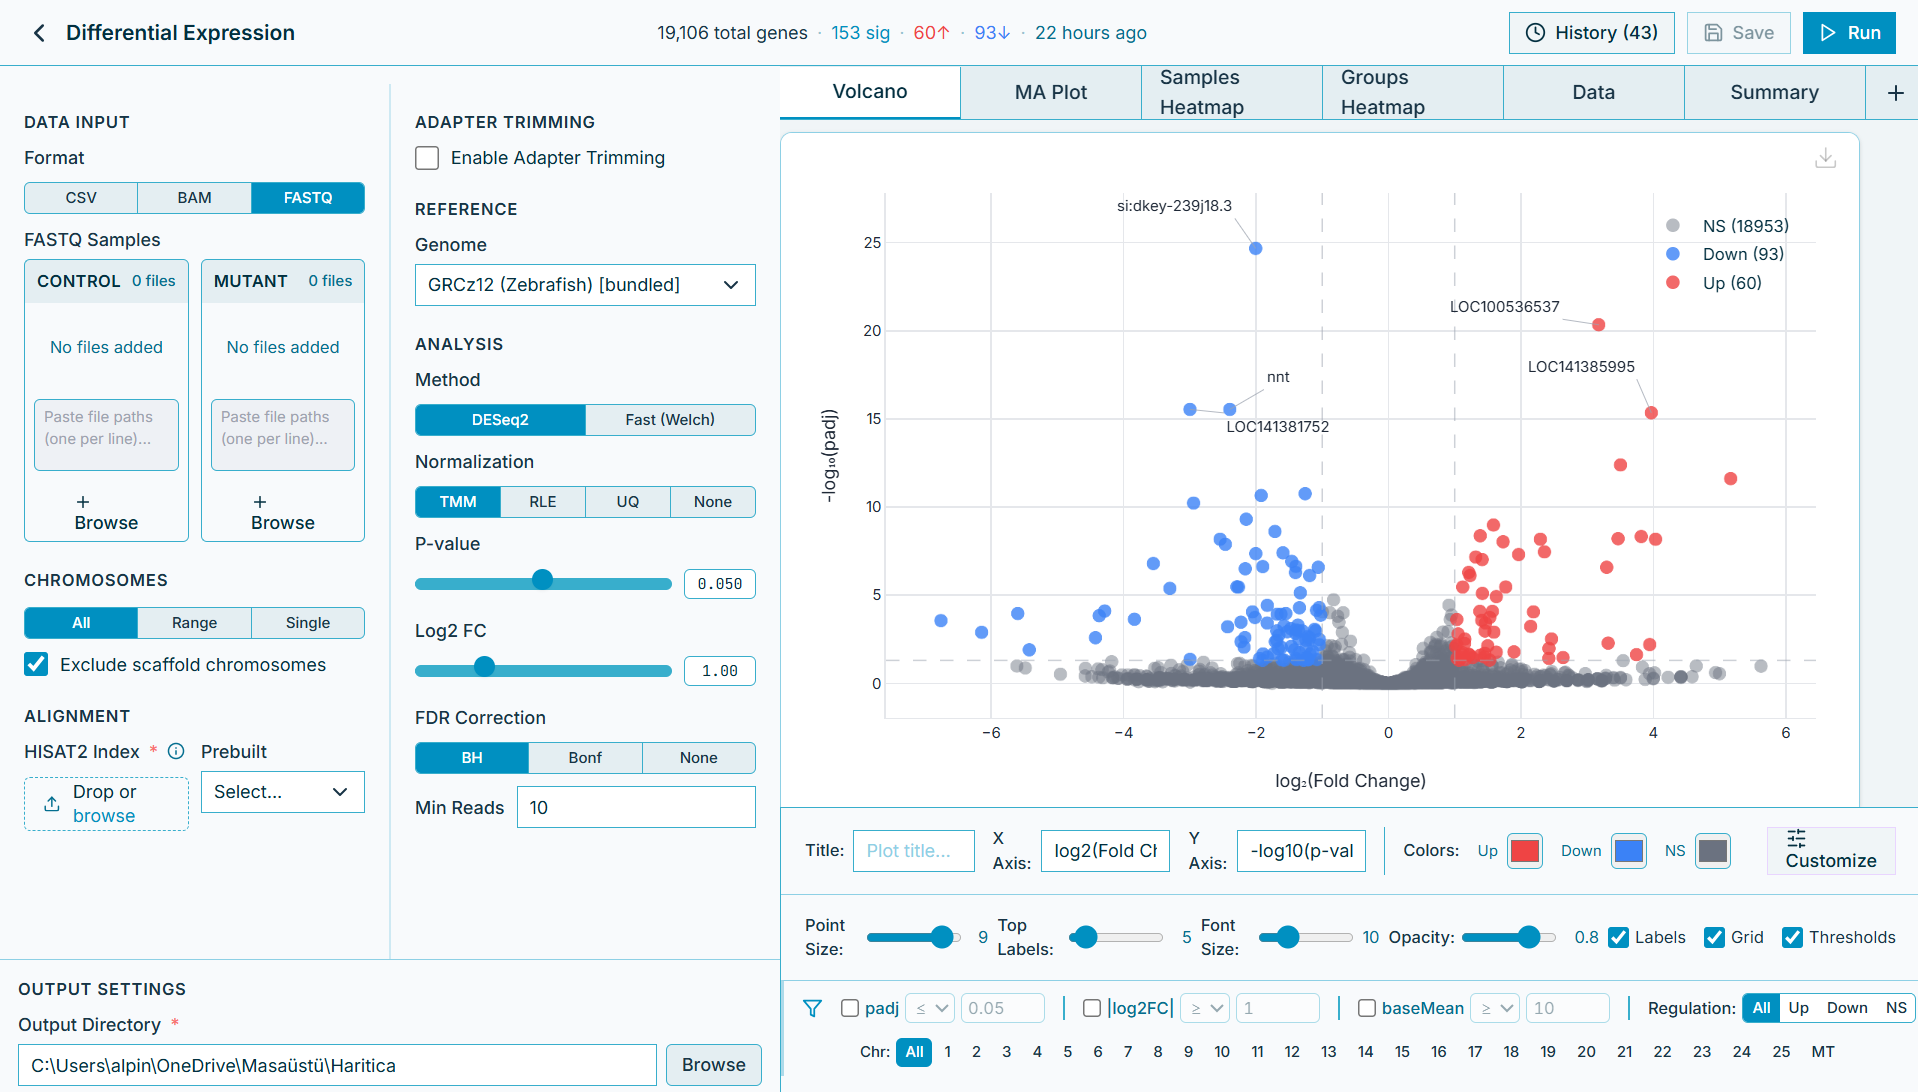
Publication-grade in minutes.
Interactive volcano plots, heatmaps and tables, ready for your next paper. Customize every detail.
The setup that used to take an afternoon.
Aligning a single RNA-seq sample the old way means installing tools, fetching genomes, and building indexes by hand.
The old way
At least 7 commands. At least 3 tools. At least an hour just to prepare files.
With Haritica
Drop FASTQ files here
or click to browse
Bundled HISAT2 indexes & GTF files. Everything ships with the app.
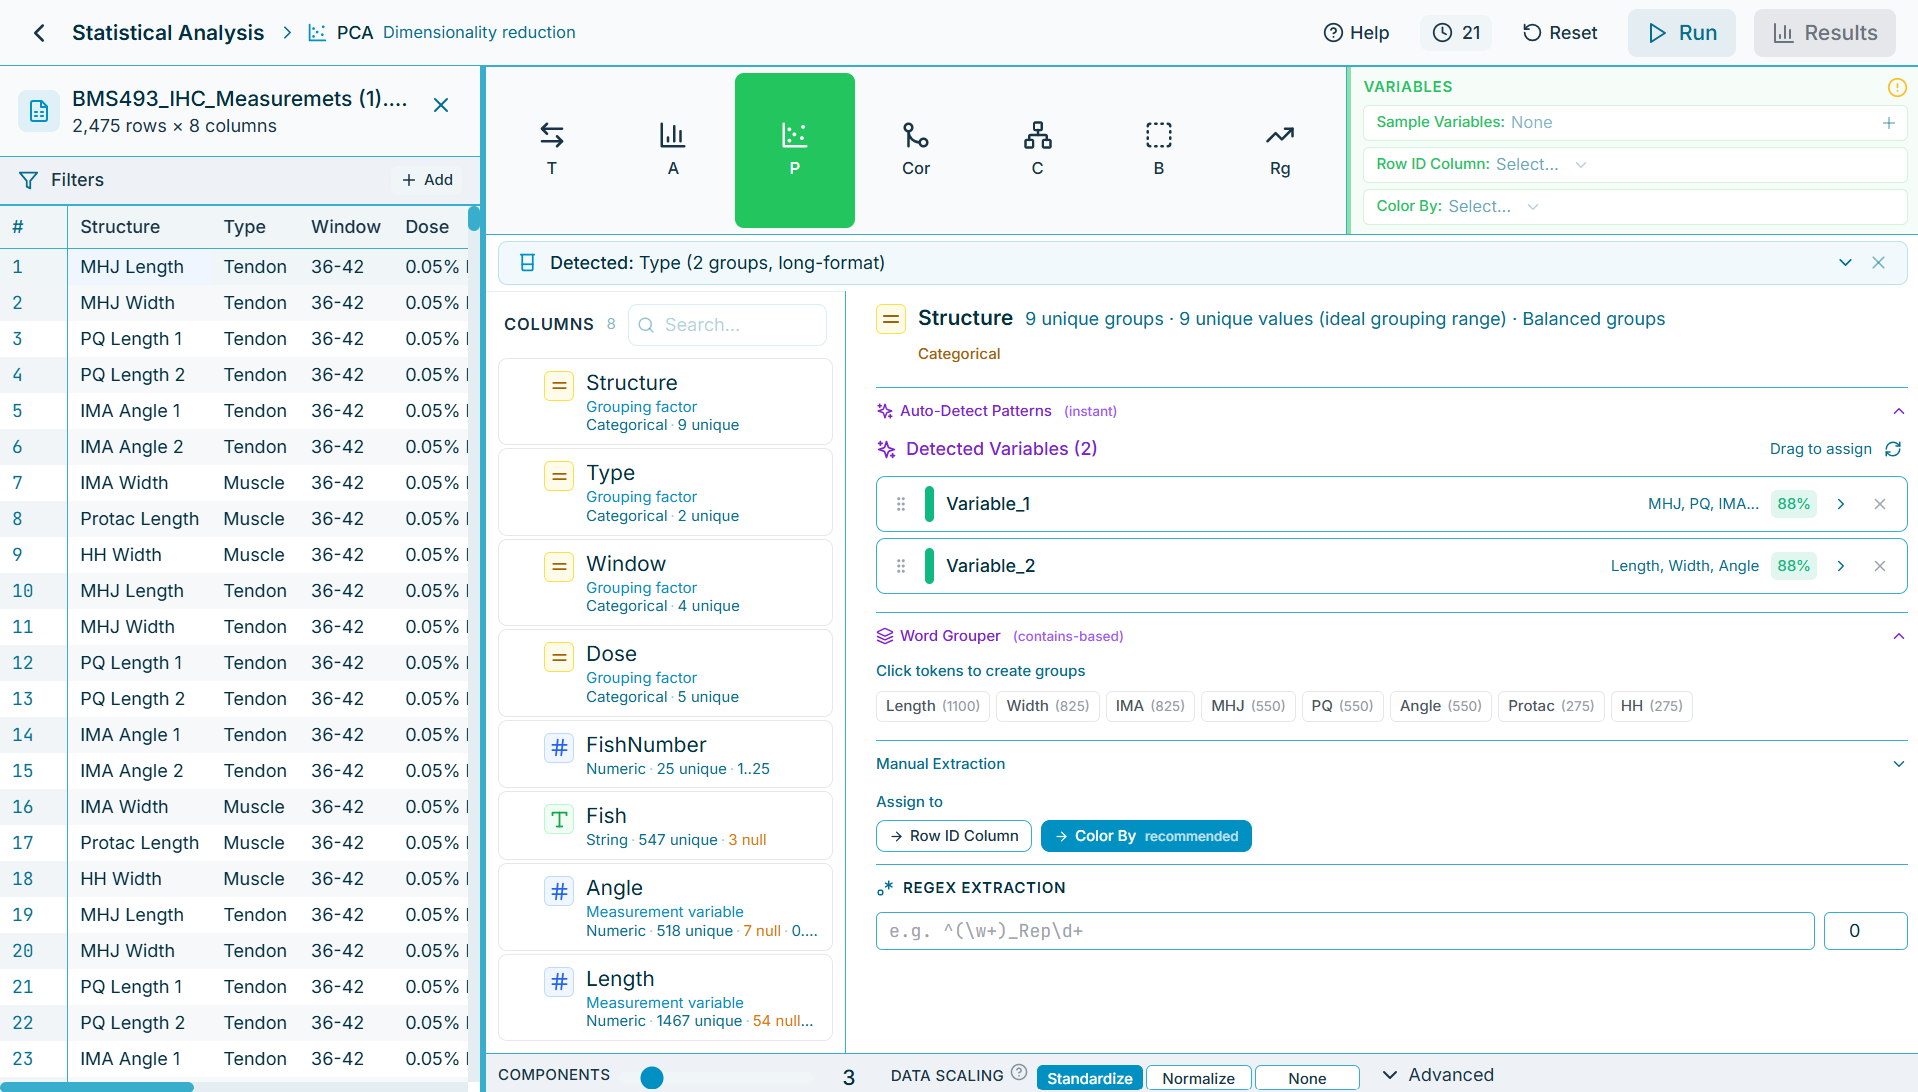
It knows which test to run.
Pick your question. Haritica recommends the appropriate statistical method and runs it for you.
Figures you can actually publish.
Volcano plots, heatmaps, UMAPs, enrichment maps and network modules — interactive, customizable, export-ready.
Your data stays yours.
The desktop app processes your data on your machine. Cloud compute is available — opt-in — when a job needs to scale beyond your local resources. No analytics, no tracking.
Start with a positive control.
Download Haritica, reproduce a published result on day one, then point it at your own data. 14-day free trial — no credit card.