2Results
2.1 Concordance
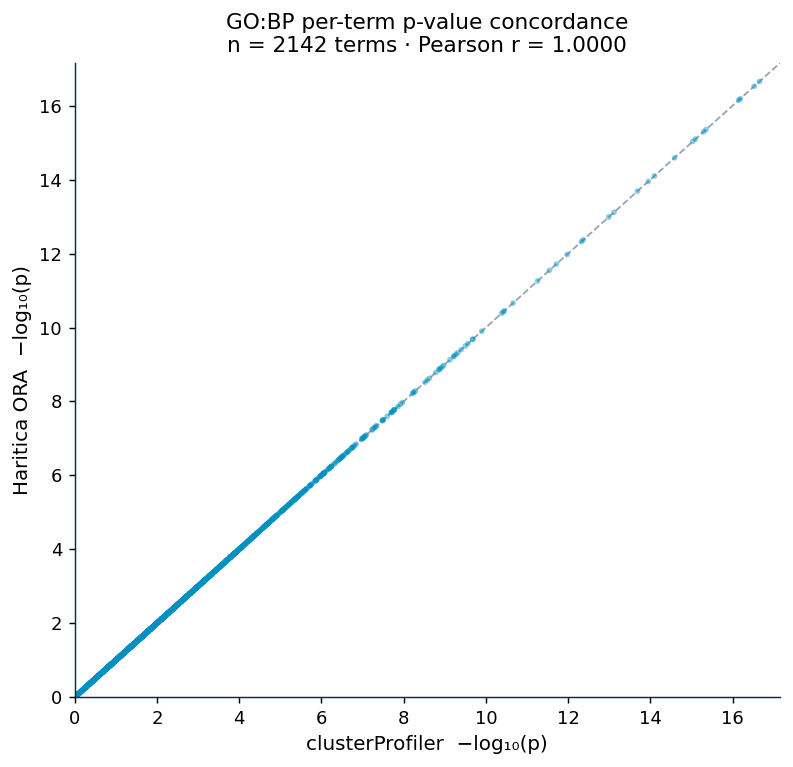
For each bundled collection the set of enriched terms, their overlap counts, and their p-values were compared term by term against clusterProfiler on the identical gene sets (Table 2). Across all six collections the enriched term sets are identical (Jaccard = 1.0000) and per-term p-values are collinear (Pearson = Spearman = 1.0000), with 100% exact agreement of overlap counts. The GO:BP scatter (Figure 1) places every one of 2,142 terms on the identity line. The recovered terms span the published glucocorticoid program: circulatory and vasculature development, extracellular-matrix organization, and the WikiPathways Glucocorticoid receptor pathway (WP2880).
| Collection | Terms | Jaccard | p Pearson | p Spearman | count |
|---|---|---|---|---|---|
| GO:BP | 2,142 | 1.0000 | 1.0000 | 1.0000 | 100% |
| GO:MF | 375 | 1.0000 | 1.0000 | 1.0000 | 100% |
| GO:CC | 262 | 1.0000 | 1.0000 | 1.0000 | 100% |
| WikiPathways | 349 | 1.0000 | 1.0000 | 1.0000 | 100% |
| Reactome | 523 | 1.0000 | 1.0000 | 1.0000 | 100% |
| Hallmark | 45 | 1.0000 | 1.0000 | 1.0000 | 100% |
scipy.stats.hypergeom reference.2.2 Plot parity
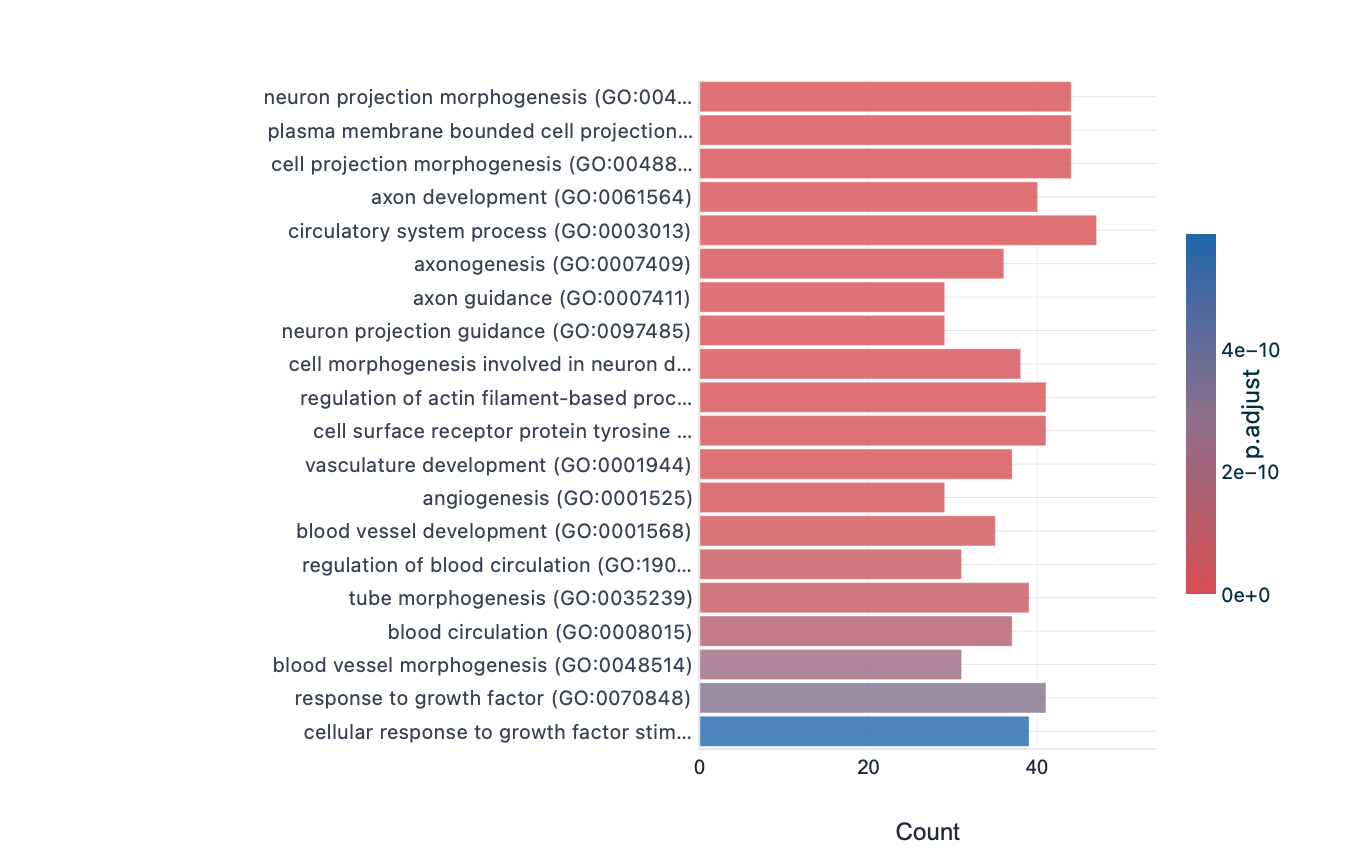
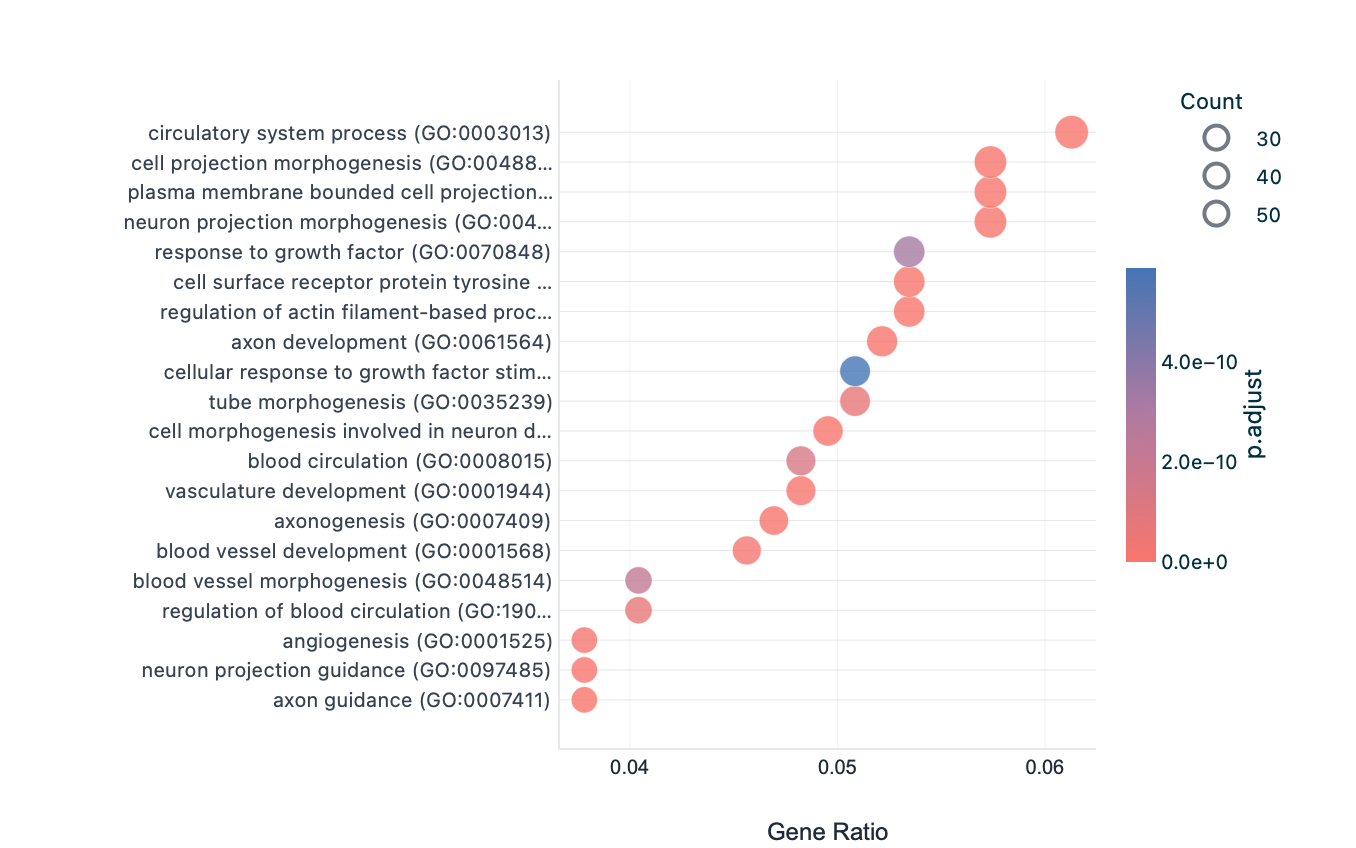
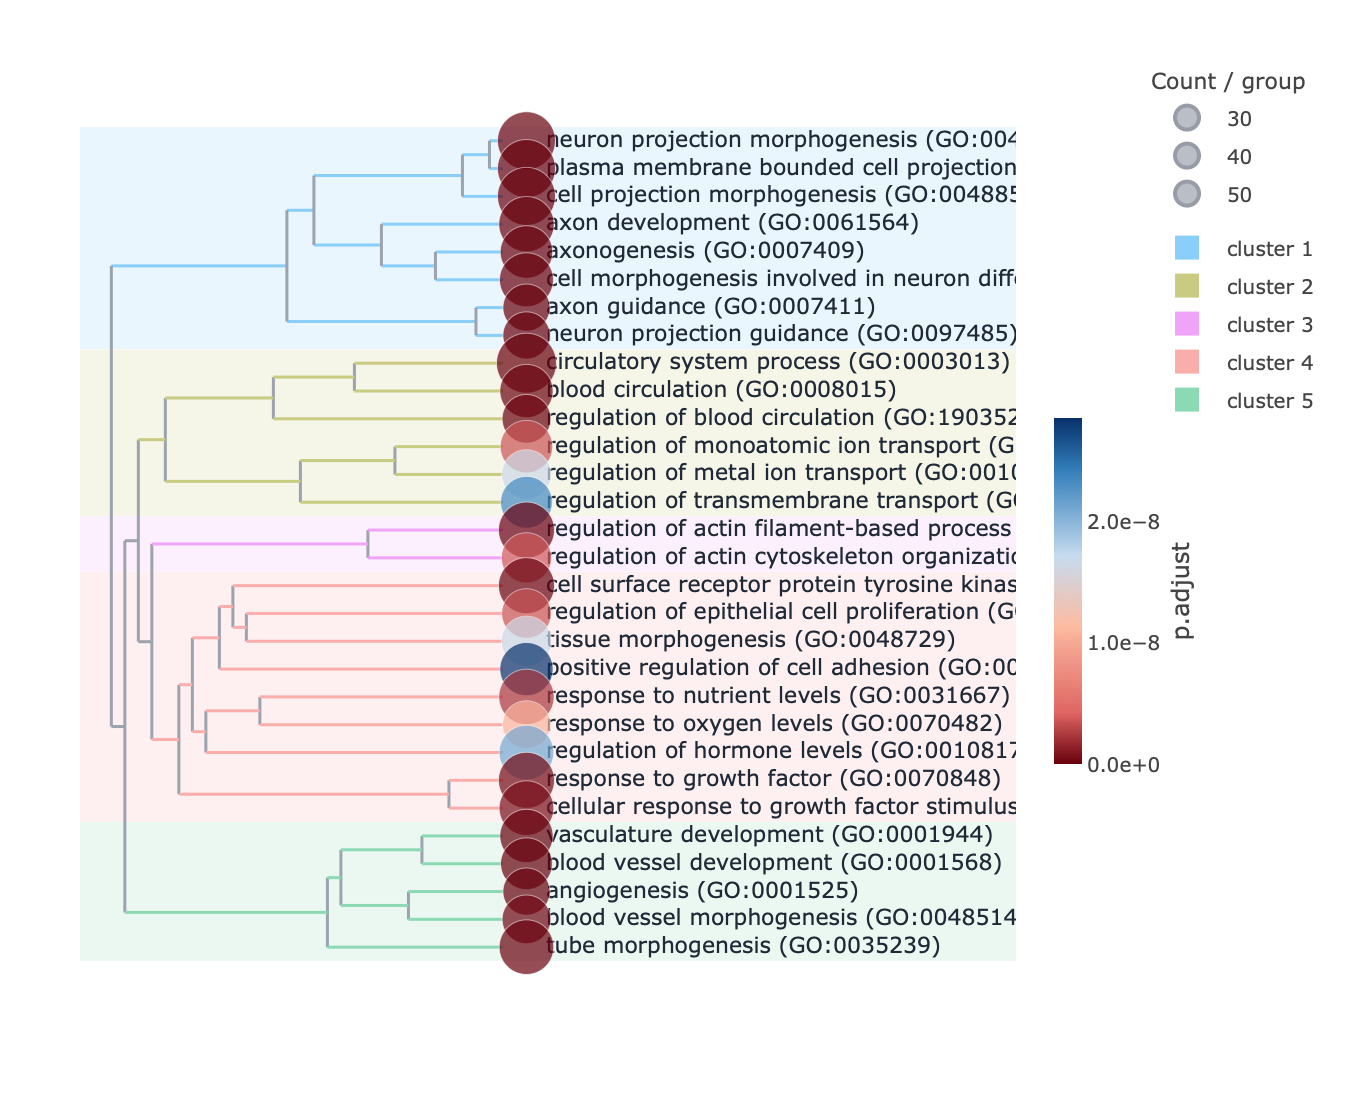
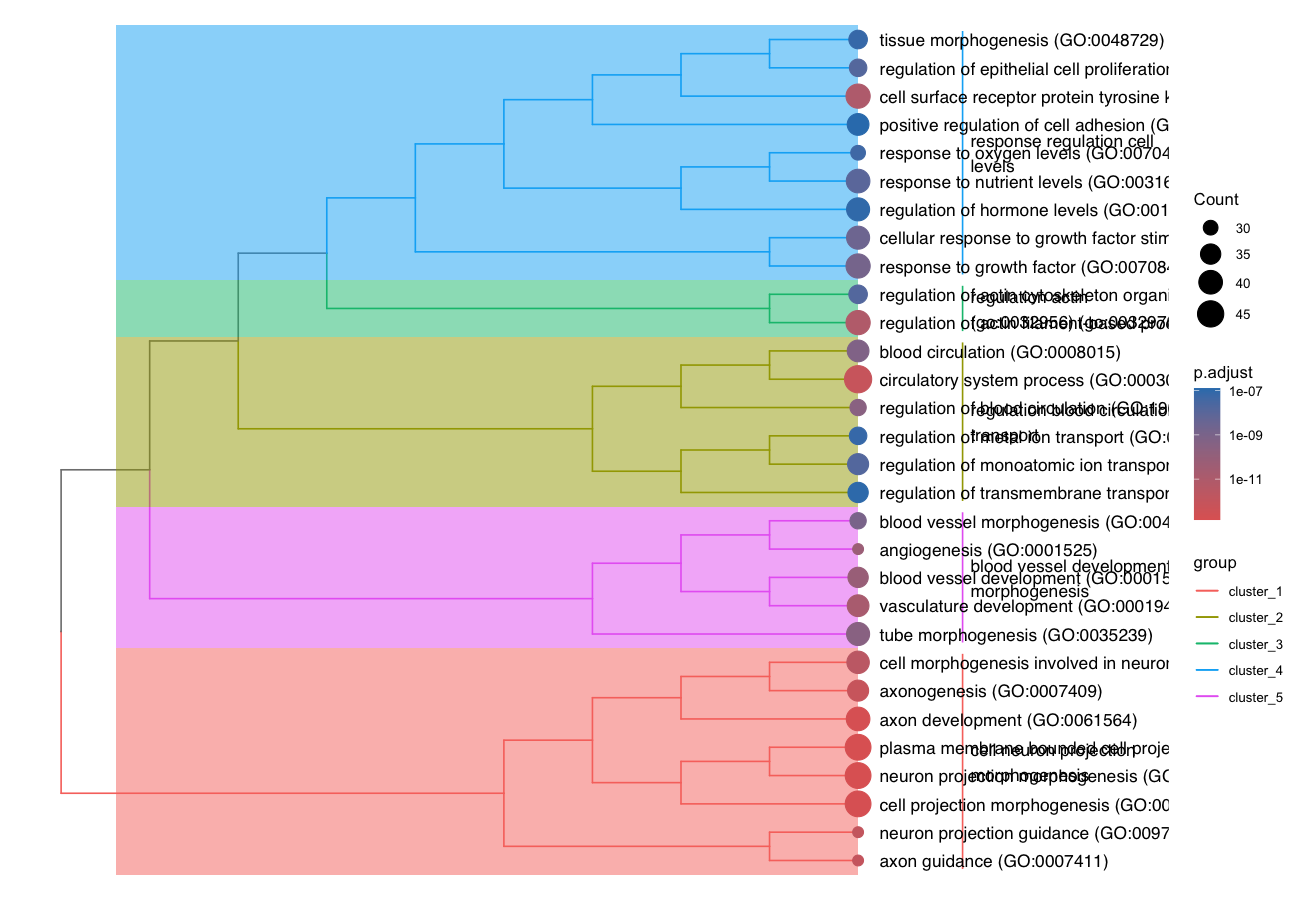
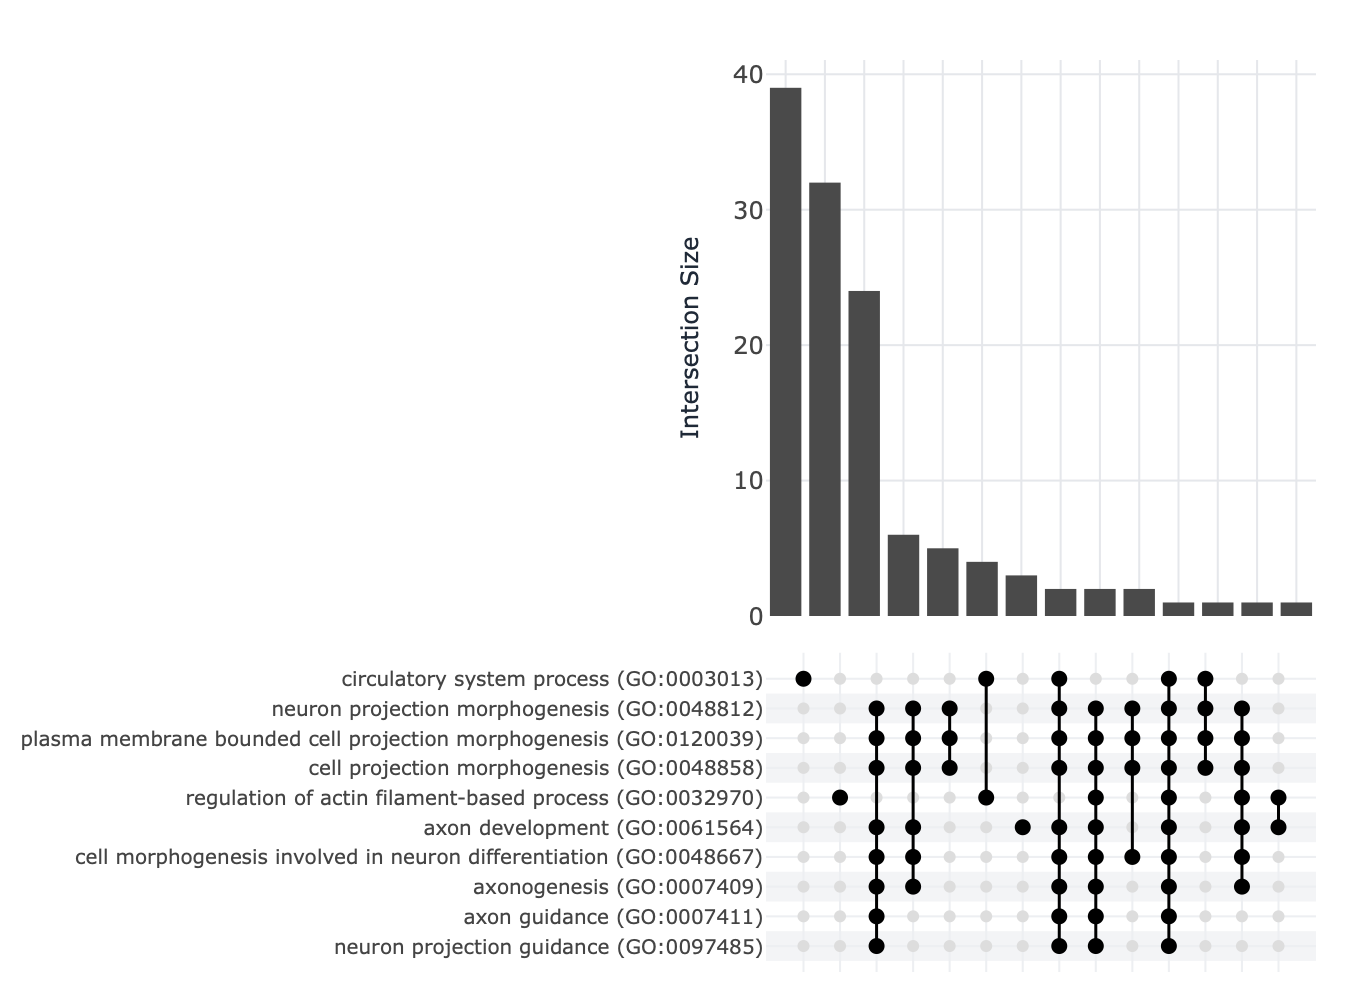
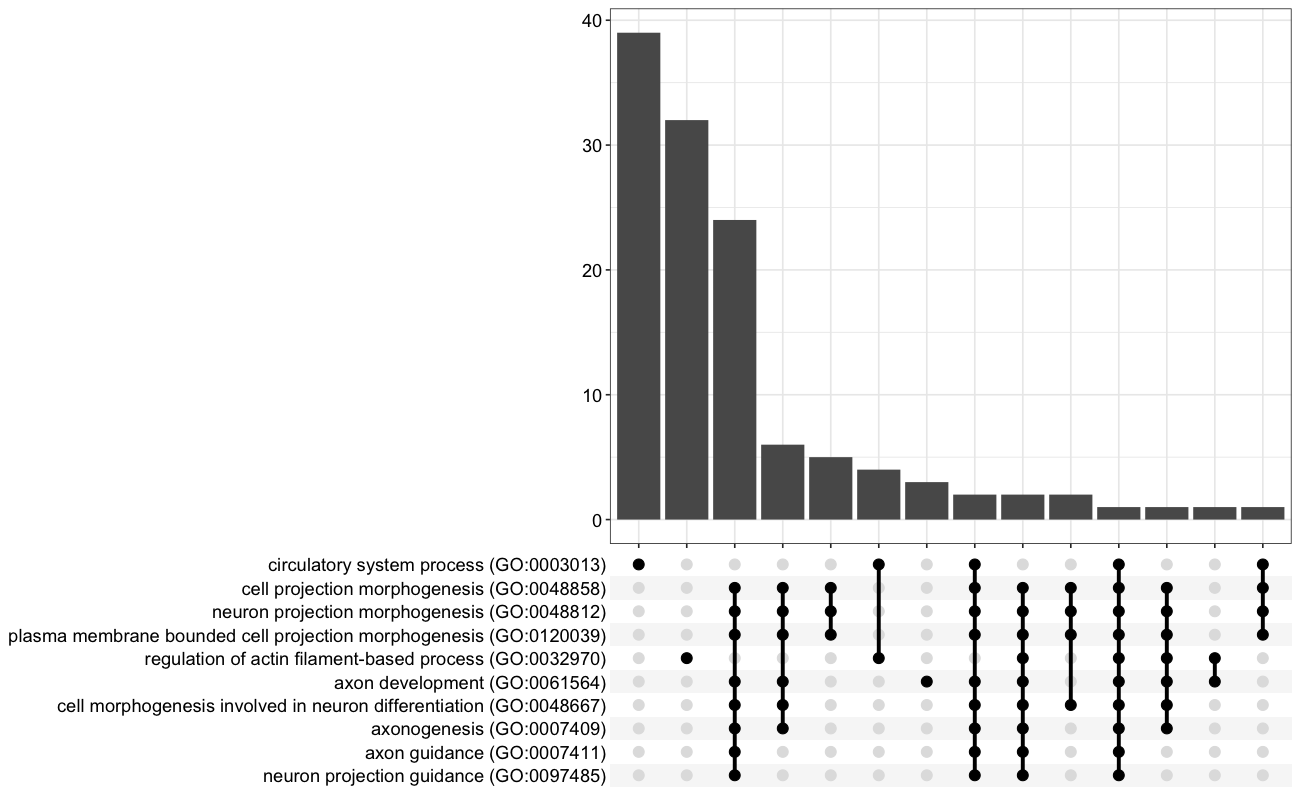
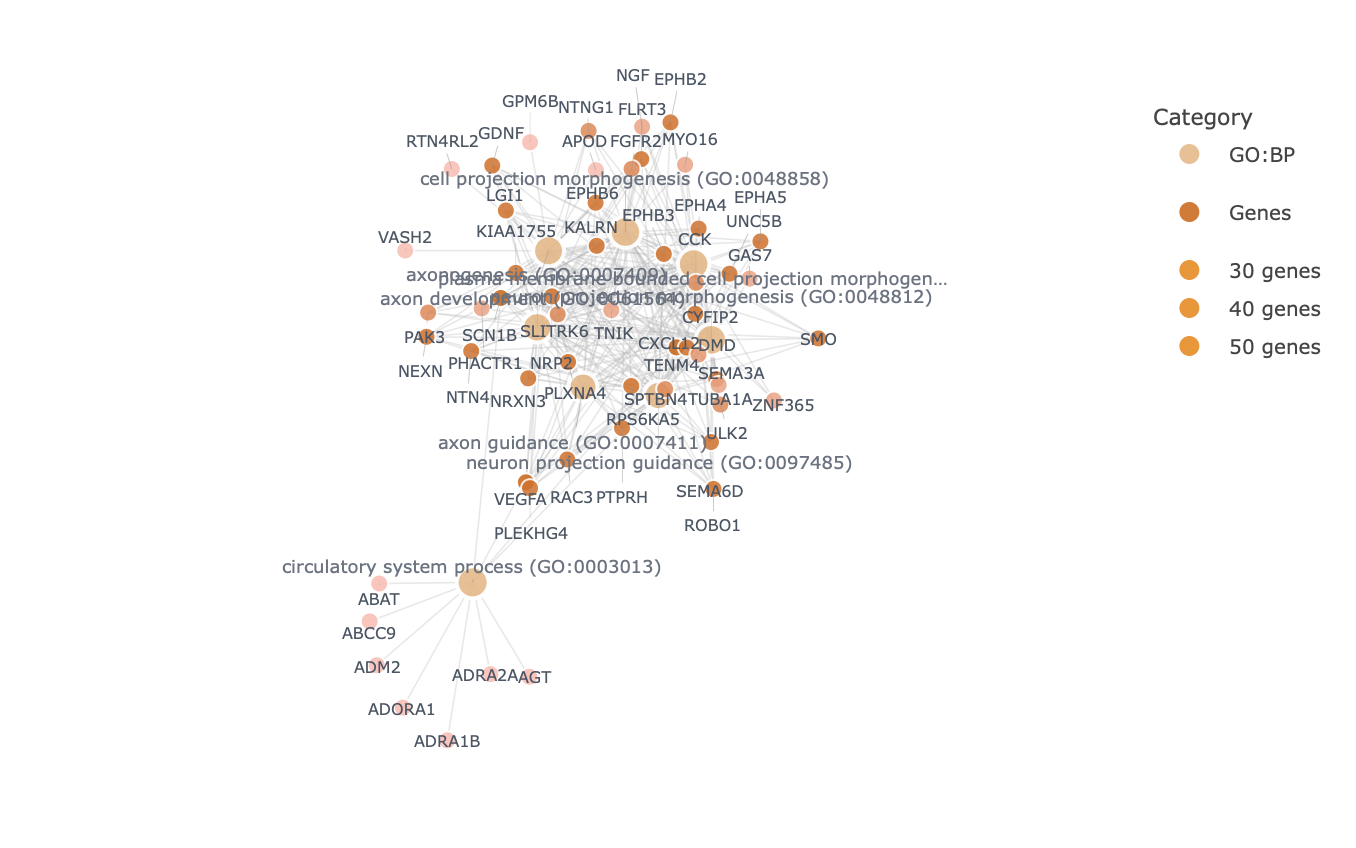
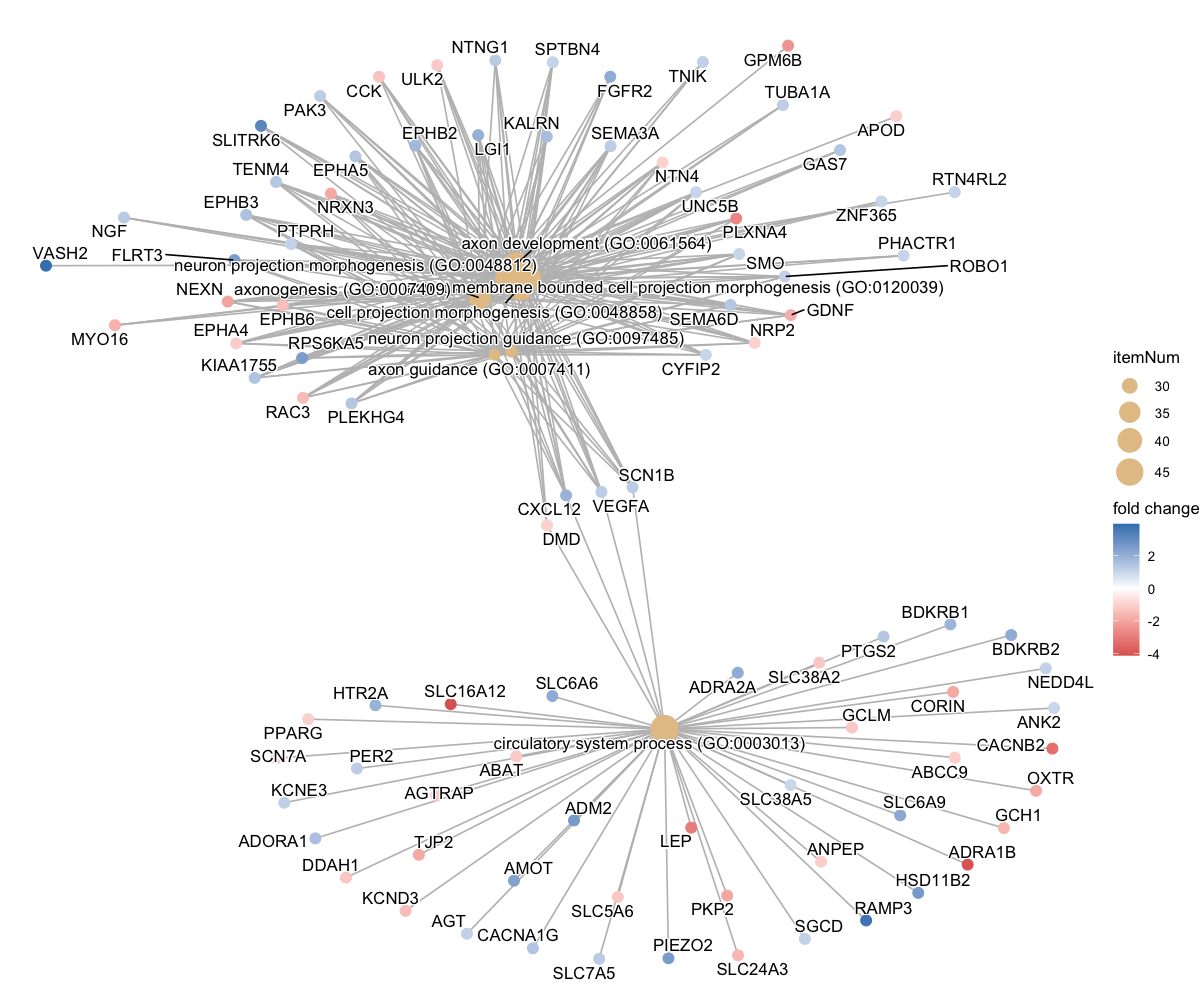
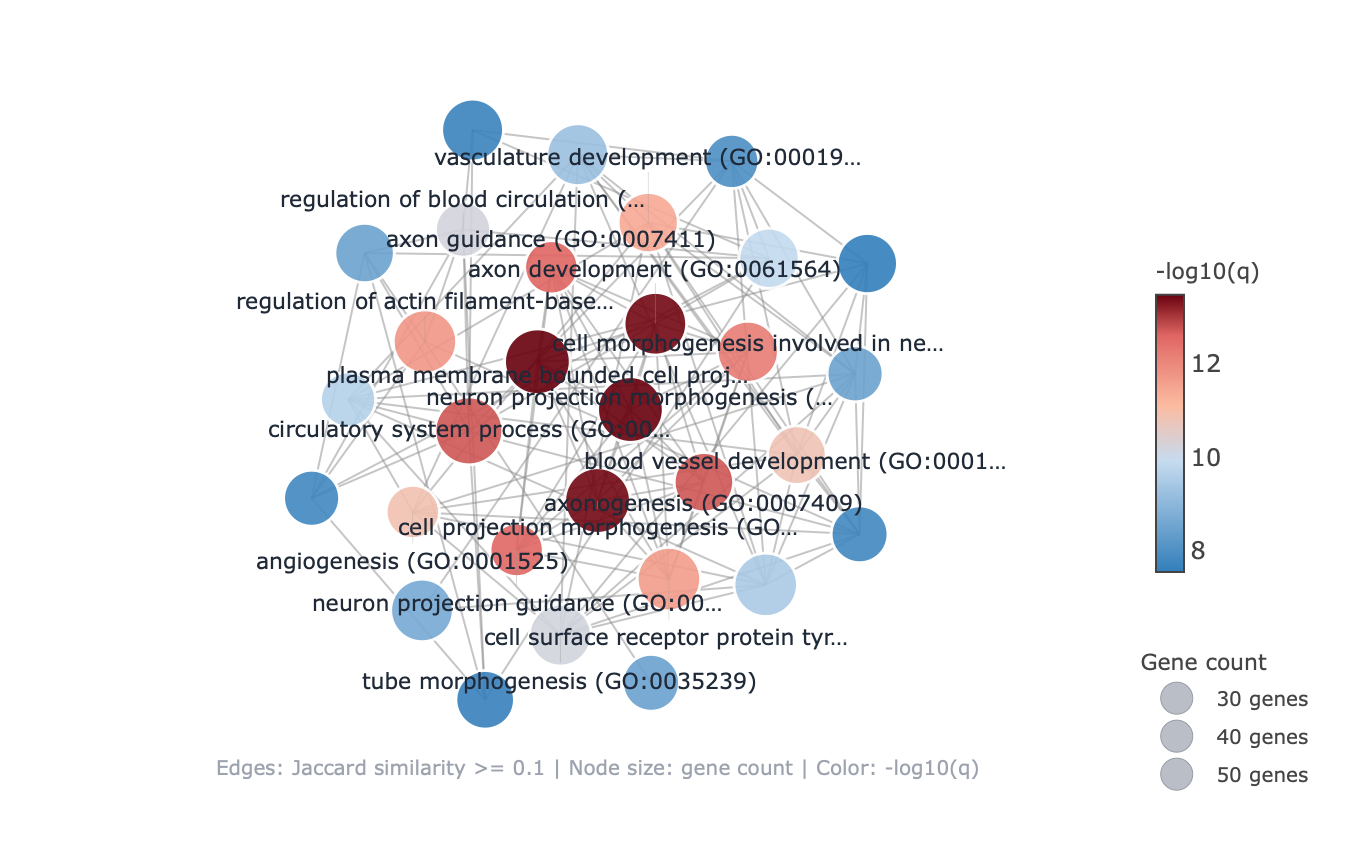
Each enrichment renderer was compared against its enrichplot reference on the same airway GO:BP gene set, with the airway DESeq2 log2 fold-changes overlaid for the heatmap and gene-network views. Both columns enrich the same 992-gene signature over the same bundled GO:BP sets, so every panel's term set, gene Count, and adjusted p-value match the reference term for term — for instance the leading term neuron projection morphogenesis (Count 44, adjusted p = 3.2×10⁻¹⁴) is identical on both sides. A plot is a drawing of already-validated numbers, so matching what enrichplot draws — given both draw the same validated numbers — is the appropriate non-circular check (Figures 2–8).
Haritica
clusterProfiler — reference
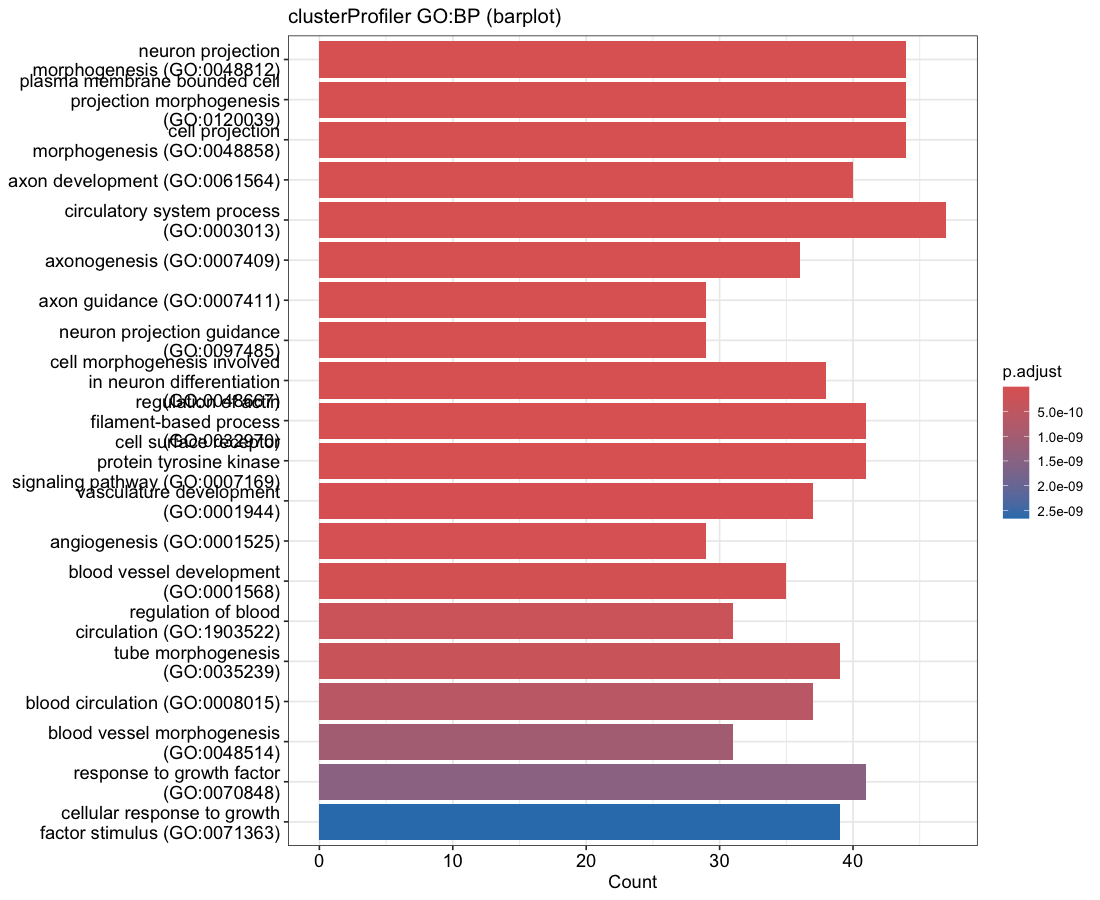
barplot default); fill encodes adjusted p-value on a linear scale, so the most-significant terms
saturate and only the least-significant drift, matching the reference. Full term names; no value labels.Haritica
clusterProfiler — reference
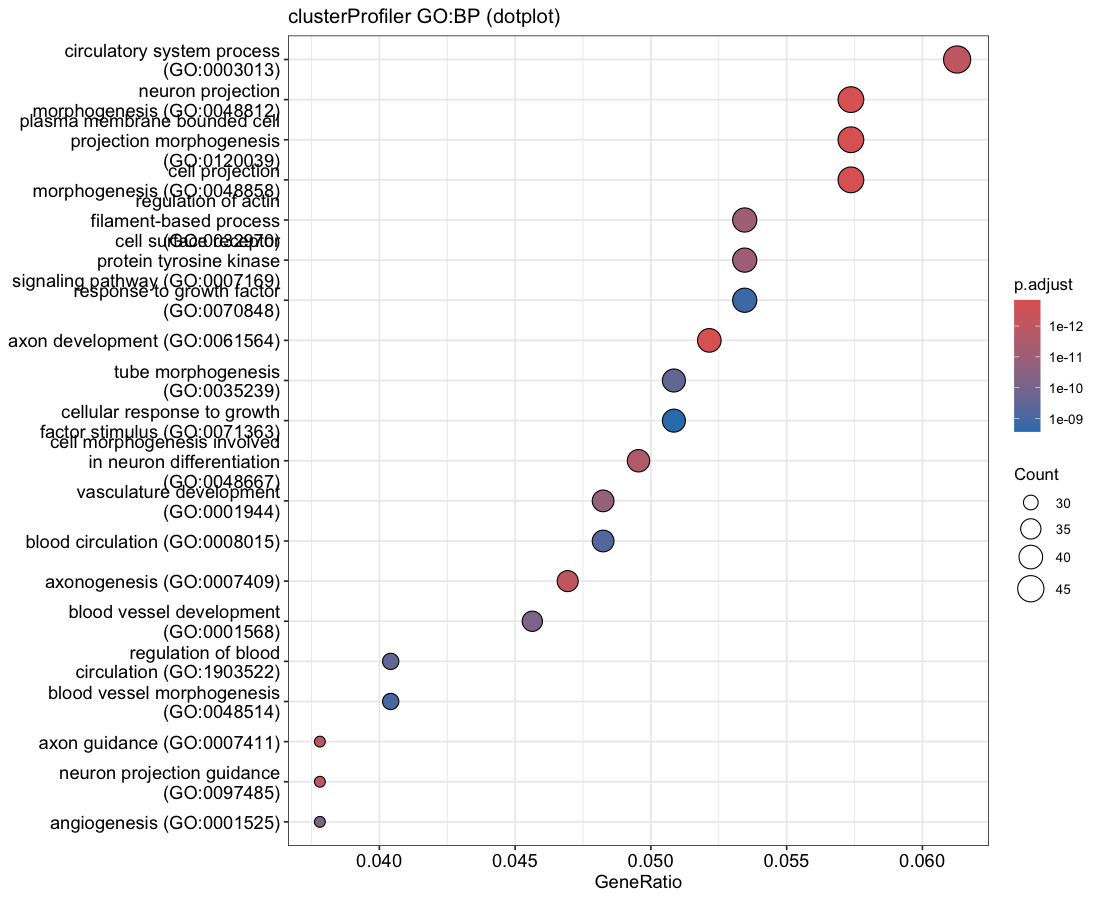
dotplot default), so the term order matches term for term.Haritica
clusterProfiler — reference
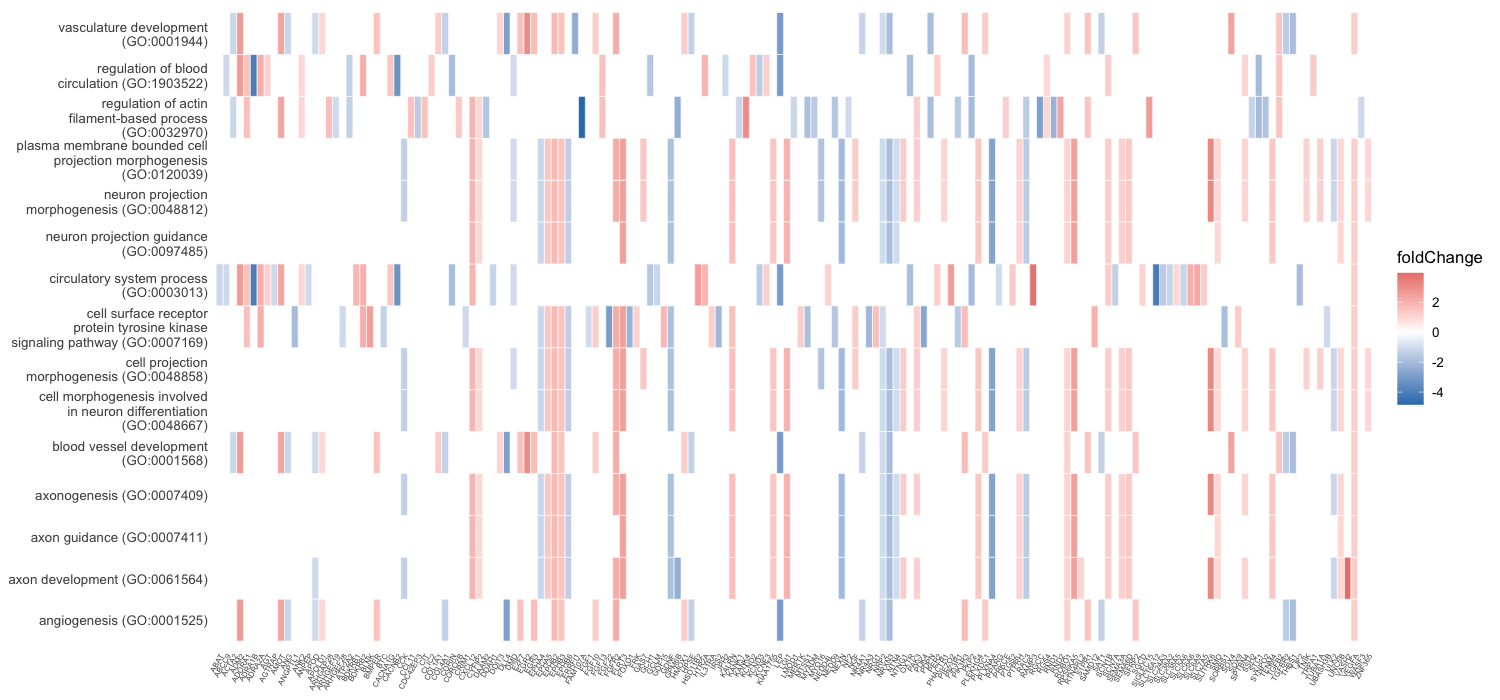
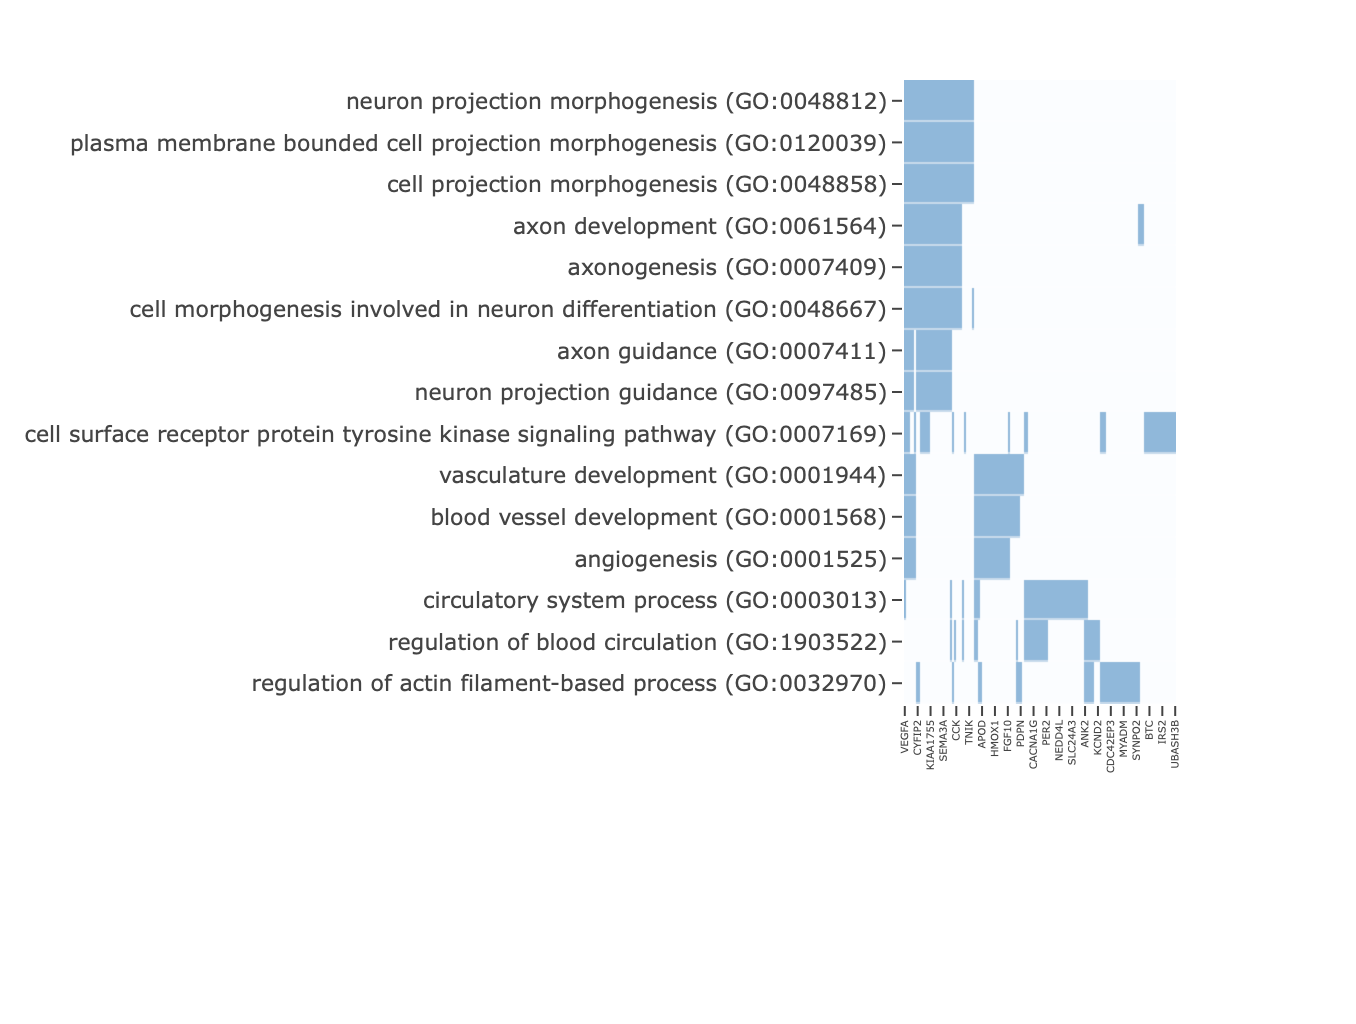
scale_fill_gradient2. Gene labels are
rendered vertically to keep the dense gene axis separable.Haritica
clusterProfiler — reference
Haritica
clusterProfiler — reference
Haritica
clusterProfiler — reference
Haritica
clusterProfiler — reference
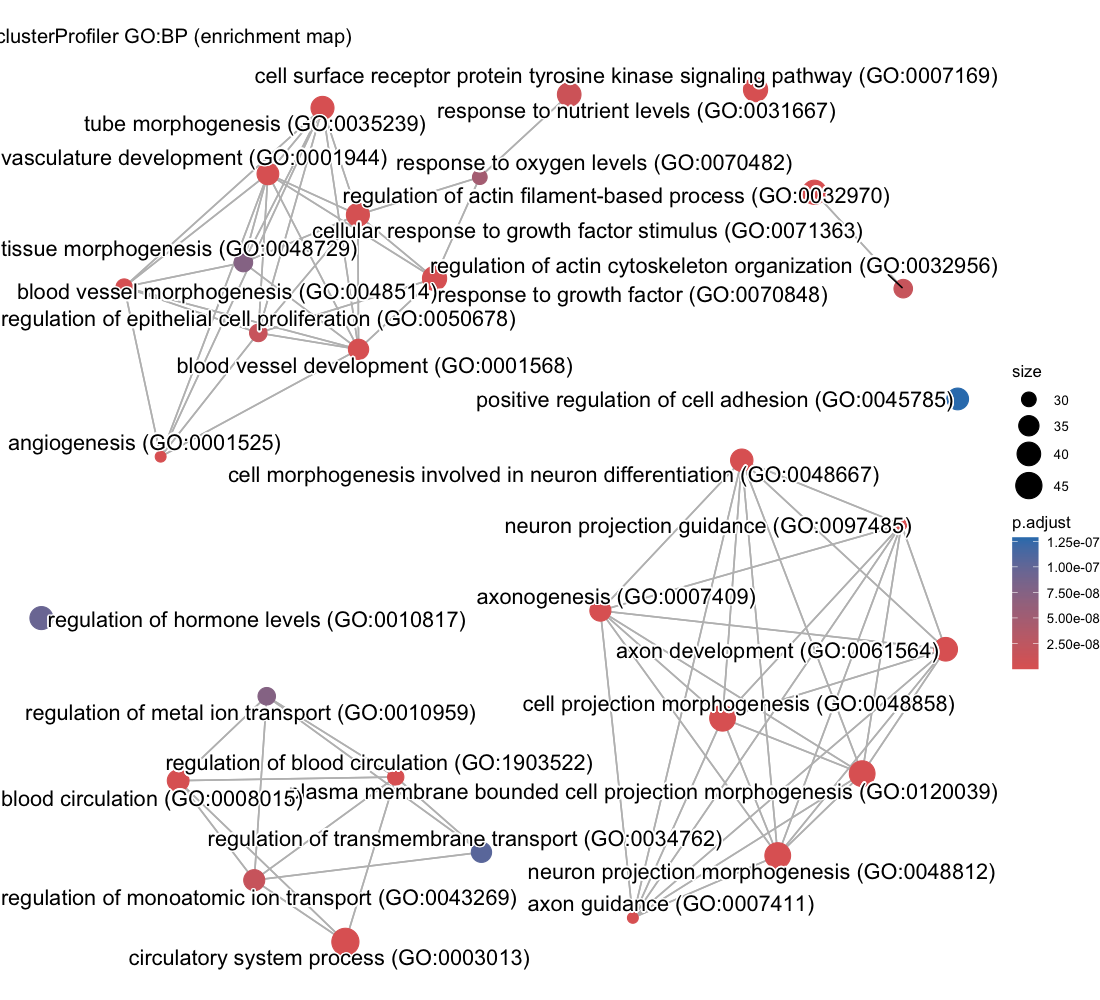
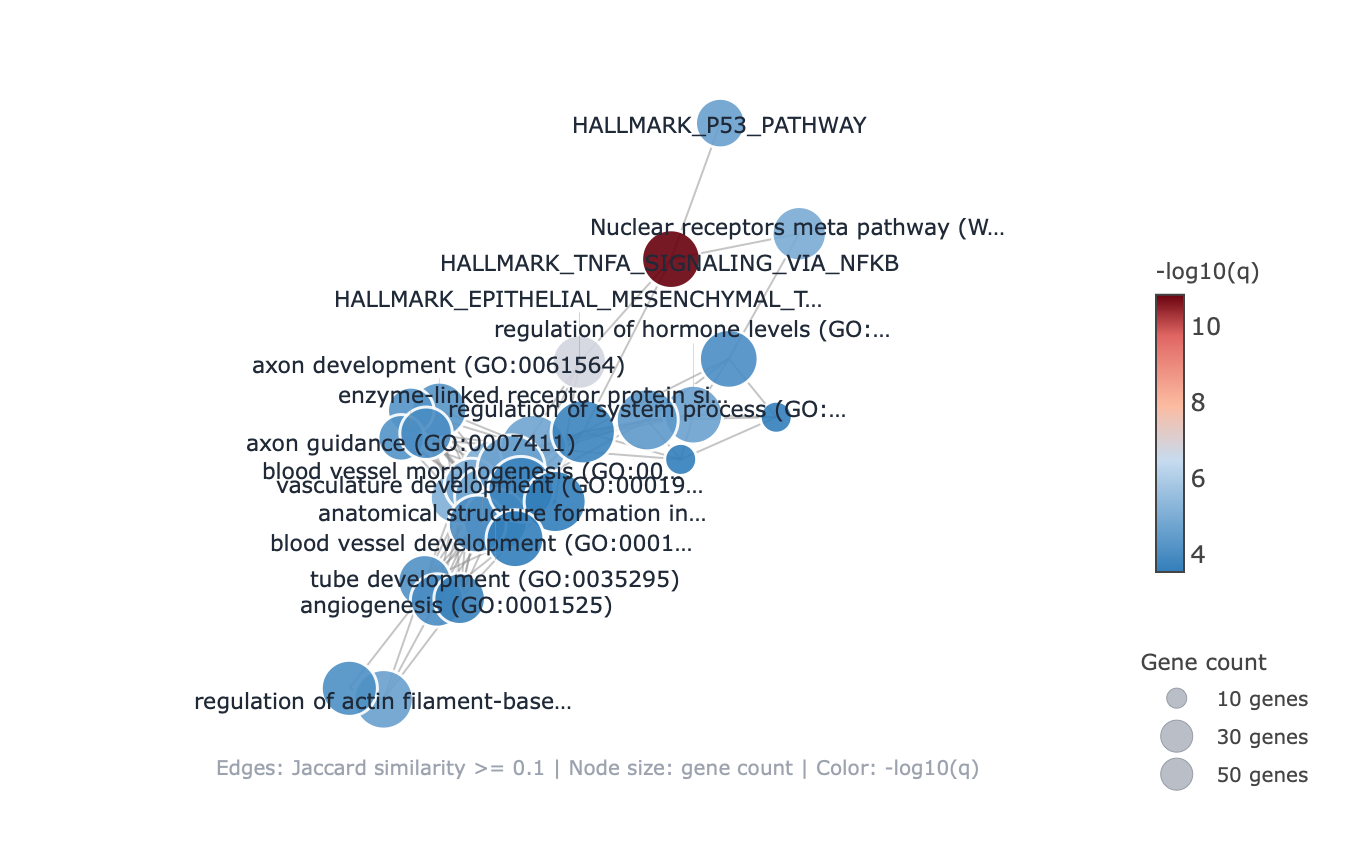
pairwise_termsim), then laid out by Fruchterman–Reingold, separating the neuron-morphogenesis
and vasculature clusters.2.3 Reproducibility — cloud and end-to-end from FASTQ
The cloud worker runs the identical enrichment engine over the same bundled gene sets as the desktop application. Run on managed cloud batch infrastructure and compared collection by collection against the local in-app result, the term counts are identical (Table 3), including the WikiPathways hits Glucocorticoid receptor pathway (WP2880), Adipogenesis (WP236), and White fat cell differentiation (WP4149).
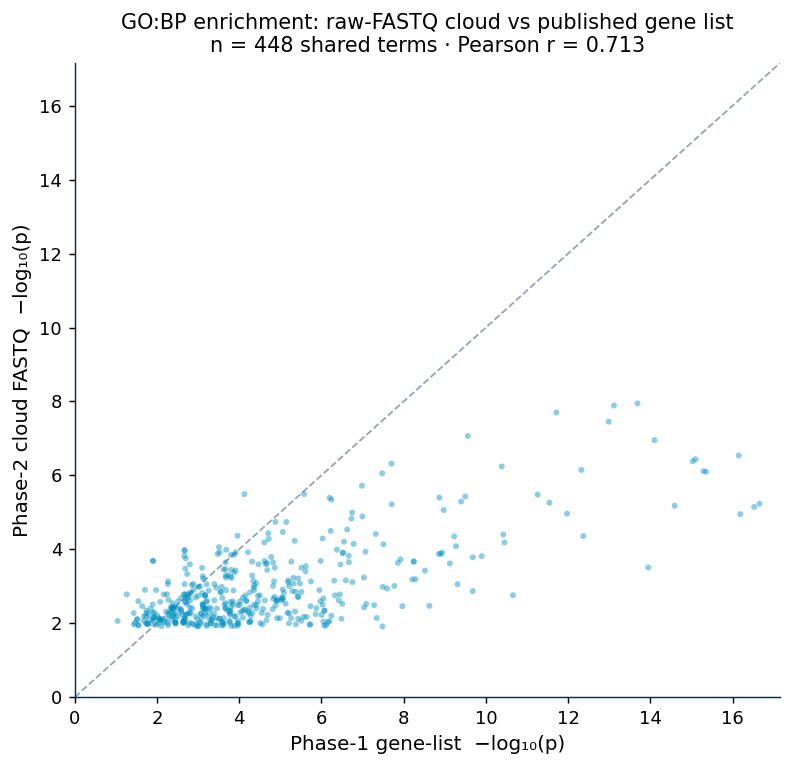
The whole pipeline was also run end to end from raw reads: the eight airway runs (SRR1039508–521, approximately 23 GB of FASTQ) were aligned with HISAT2 to GRCh38 (97–98% per sample), quantified with featureCounts, tested with pyDESeq2 (adjusted p < 0.05, |log2FC| > 1; 837 genes), and enriched with the bundled collections (651 terms). HISAT2 is used here rather than minimap2 because minimap2's spliced-alignment preset targets long reads; on short paired-end RNA-seq the splice-aware short-read aligner is appropriate. The cloud FASTQ run (837 genes) and the published gene list (992 genes) are two independent differential-expression analyses of the same experiment; on the 448 shared GO:BP terms their per-term significance correlates at Pearson r = 0.71 (Figure 9), the more conservative correlation expected from a smaller independent DE call rather than the engine-vs-engine r = 1.0 of §2.1. Ten of twelve canonical airway markers (CRISPLD2, KLF15, FKBP5, GPX3, PER1, ZBTB16, SPARCL1, TSC22D3, STEAP2, MAOA) are significant in both runs, and all four published functional axes (hormone/steroid response, vasculature, extracellular matrix, muscle/contraction) are recovered in the cloud GO:BP set.
| Collection | Local (in-app) | Cloud (batch) |
|---|---|---|
| GO:BP | 1,312 | 1,312 |
| Reactome | 120 | 120 |
| WikiPathways | 76 | 76 |
| Hallmark | 9 | 9 |
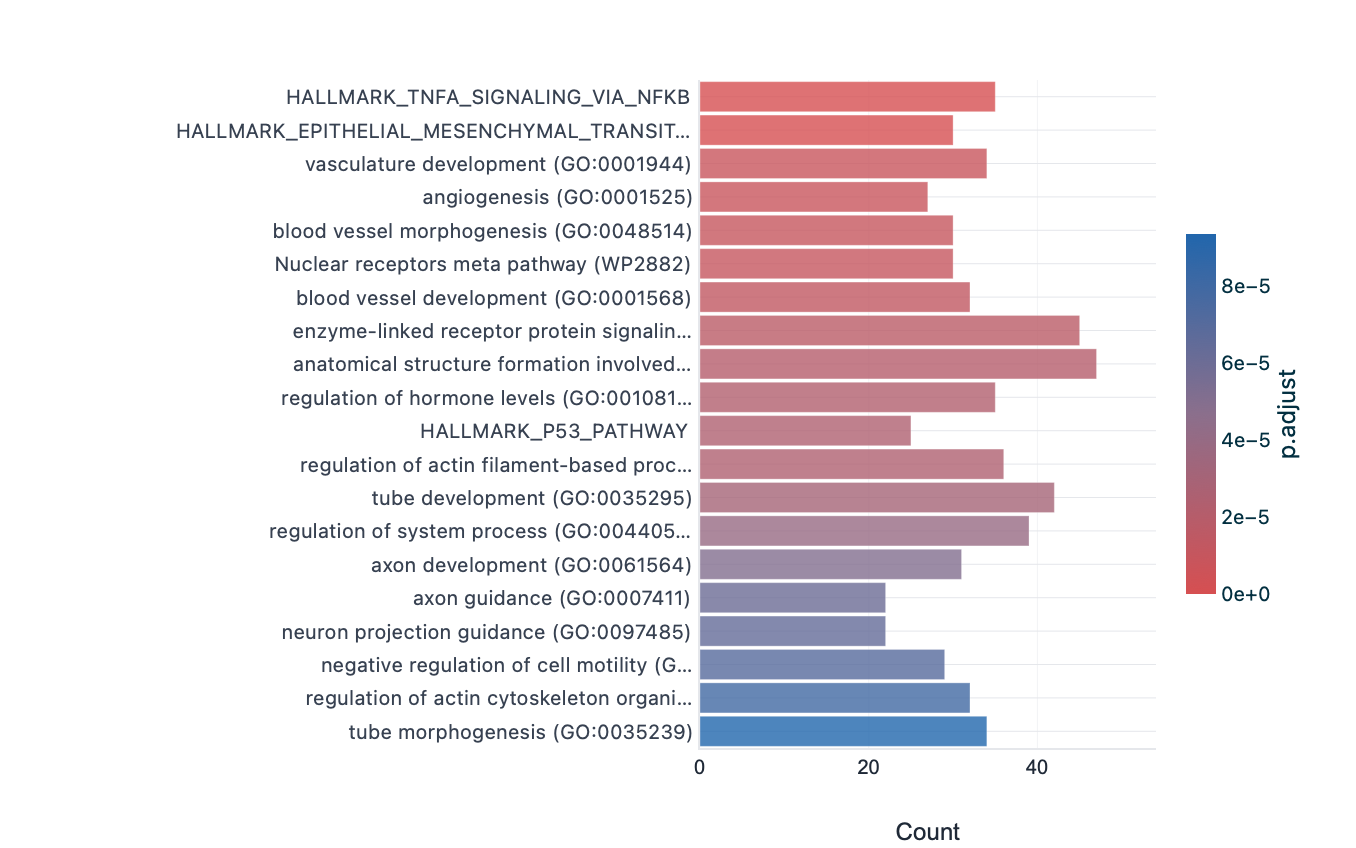
Cloud FASTQ — bar plot
Cloud FASTQ — enrichment map