Positive control · 10x PBMC 1k v3 · Homo sapiens, peripheral blood mononuclear cells · Leiden clustering
Validation of Haritica single-cell Leiden clustering against external quantification and an independent Scanpy workflow
Raw 10x PBMC 1k v3 FASTQ processed end-to-end in Haritica (kallisto | bustools) and validated against an external CellRanger quantification of the same reads and an independent Scanpy Leiden on the identical counts
Dataset 10x Genomics PBMC 1k v3 (public raw FASTQ) · quantification kallisto 0.51.1 | bustools · external reference 10x CellRanger; independent reference Scanpy 1.12 (Leiden) on the identical counts · Homo sapiens GRCh38, Ensembl 110 · 2026
Abstract. Raw 10x Genomics PBMC 1k v3 FASTQ (two lanes, 66.6 M reads) were processed end-to-end in
Haritica — pseudoalignment and quantification, then quality control, normalization, PCA, a
Leiden multi-resolution clustering gallery, marker detection, and cell-type annotation. The gallery
produces 15 distinct, monotone partitions (4→14 clusters across resolutions 0.1–1.5), and at the
selected resolution 0.8 the twelve Leiden clusters recover all nine canonical peripheral-blood populations.
We validate this on three independent axes. (1) Haritica's kallisto | bustools quantification
agrees with 10x's own CellRanger matrix of the same FASTQs — 1,194 vs 1,222 cells (97.7%), per-gene
Spearman ρ = 0.92 on shared cells with a log-log slope of 0.81 (the expected
pseudoalignment signature). (2) An independent Scanpy Leiden on the identical counts agrees with
Haritica's per-cell partition at adjusted Rand index 0.75–0.77 (AMI 0.86–0.87), against a
permutation null of ~0 (p < 0.001). (3) Each cluster's unsupervised
differential-expression ranking surfaces the published canonical lineage markers near the top. Cell recovery is
1,194 → 1,111 after quality filtering. The validation is biological and methodological —
recovery of known cell-type biology, corroborated by an external quantification and an independent tool —
not a claim of numeric identity.
1Data and methods
The dataset is the 10x Genomics PBMC 1k v3 sample: public raw FASTQ from peripheral blood mononuclear cells
of a healthy donor (10x v3 chemistry, two lanes, 66.6 M reads). The two lanes were pseudoaligned and
quantified with kallisto 0.51.1 | bustools against an Ensembl GRCh38 (release 110) index,
merging the lanes into one sample (56.3% pseudoaligned → 1,194 cells × 35,720 genes). Cells
were quality-filtered (200–5,000 detected genes, mitochondrial fraction below 20%, genes in at least three
cells; counts unconstrained), log-normalized (log1p CP10k) with mitochondrial regression, reduced to the 2,000
most variable genes, scaled, and projected onto principal components. A neighbour graph
(k = 15) over the PCA embedding supported Leiden community detection, swept across fifteen
resolutions (0.1–1.5) as a gallery; resolution 0.8 (twelve clusters) was selected. Per-cluster markers
were ranked by the Wilcoxon rank-sum test and clusters were assigned cell types by canonical-marker signature
scoring. Of 1,194 cells called, 1,111 passed quality control.
Table 1. Analysis parameters for the Haritica run, beside the matched references.
Parameter
Haritica
References
Quantification
kallisto 0.51.1 | bustools (GRCh38, Ensembl 110)
10x CellRanger filtered matrix (same FASTQs); independent Scanpy on the identical counts
Three references, each independent of Haritica's analysis code in a different way. (i) An external
quantification. 10x Genomics publishes a CellRanger filtered_feature_bc_matrix for this exact
sample — a count matrix produced by a third party, with a different aligner (STAR, splice-aware), from the
same FASTQs. It is the first genuinely external check in this control series. (ii) Canonical marker
biology. Decades of immunology fix the lineage genes of each PBMC population (MS4A1/CD79A = B,
CD14/LYZ = CD14+ mono, FCGR3A/MS4A7 = FCGR3A+ mono,
CD8A/GZMK = CD8 T, IL7R/CD3D = CD4 T,
GNLY/KLRD1 = NK, PPBP = platelet, …). (iii) An independent
implementation. Vanilla Scanpy (Wolf et al. 2018) — sharing no code with Haritica — run on
Haritica's own counts under matched parameters, differing only in the software.
1.2 How the figures were produced
Every Haritica figure in this report is captured directly from the running application; the reference figures
are produced by an independent Scanpy workflow on the identical counts.
1.3 Scope and limitations
Each arm is independent of Haritica's analysis code in a different way, and the scope of each differs.
Quantification (Arm 1) is externally checked: CellRanger's matrix is produced by 10x, with a
different aligner, from the same FASTQs. Because kallisto pseudoalignment excludes intronic reads that
CellRanger's splice-aware alignment counts, a per-gene rank correlation below 1 with a log-log slope below 1 is
the expected result for the two methods (Figure 3). Clustering reproducibility (Arm 2) is measured on
shared counts: the independent Scanpy Leiden runs on Haritica's own counts, so the adjusted Rand index measures
reproducibility of the downstream clustering with quantification held fixed (checked separately by Arm 1).
The cell-type labels are assigned by a marker-scoring rule applied identically to both arms; the genuinely
independent biological signal is the rank of an external published marker panel within Haritica's unsupervised
differential expression (Arm 3), a ranking that never sees the panel. Residual clustering disagreement
(ARI ~0.75) reflects Leiden's known resolution and seed sensitivity — a small number of cluster splits,
not a structural discordance. This is one dataset; independence here is methodological (external
quantification, separate standard software, published biology).
2Results
The Leiden gallery produces fifteen distinct, monotone partitions (§2.1, Figure 2,
Table 4). Haritica's quantification matches the external CellRanger matrix as expected for pseudoalignment
(§2.2, Table 2, Figures 3–4). The per-cell partition is reproduced by an independent Scanpy
Leiden (§2.3, Table 3, Figure 5). The twelve clusters recover the canonical PBMC populations
(§2.4–2.5, Figure 1), each defined by its textbook markers.
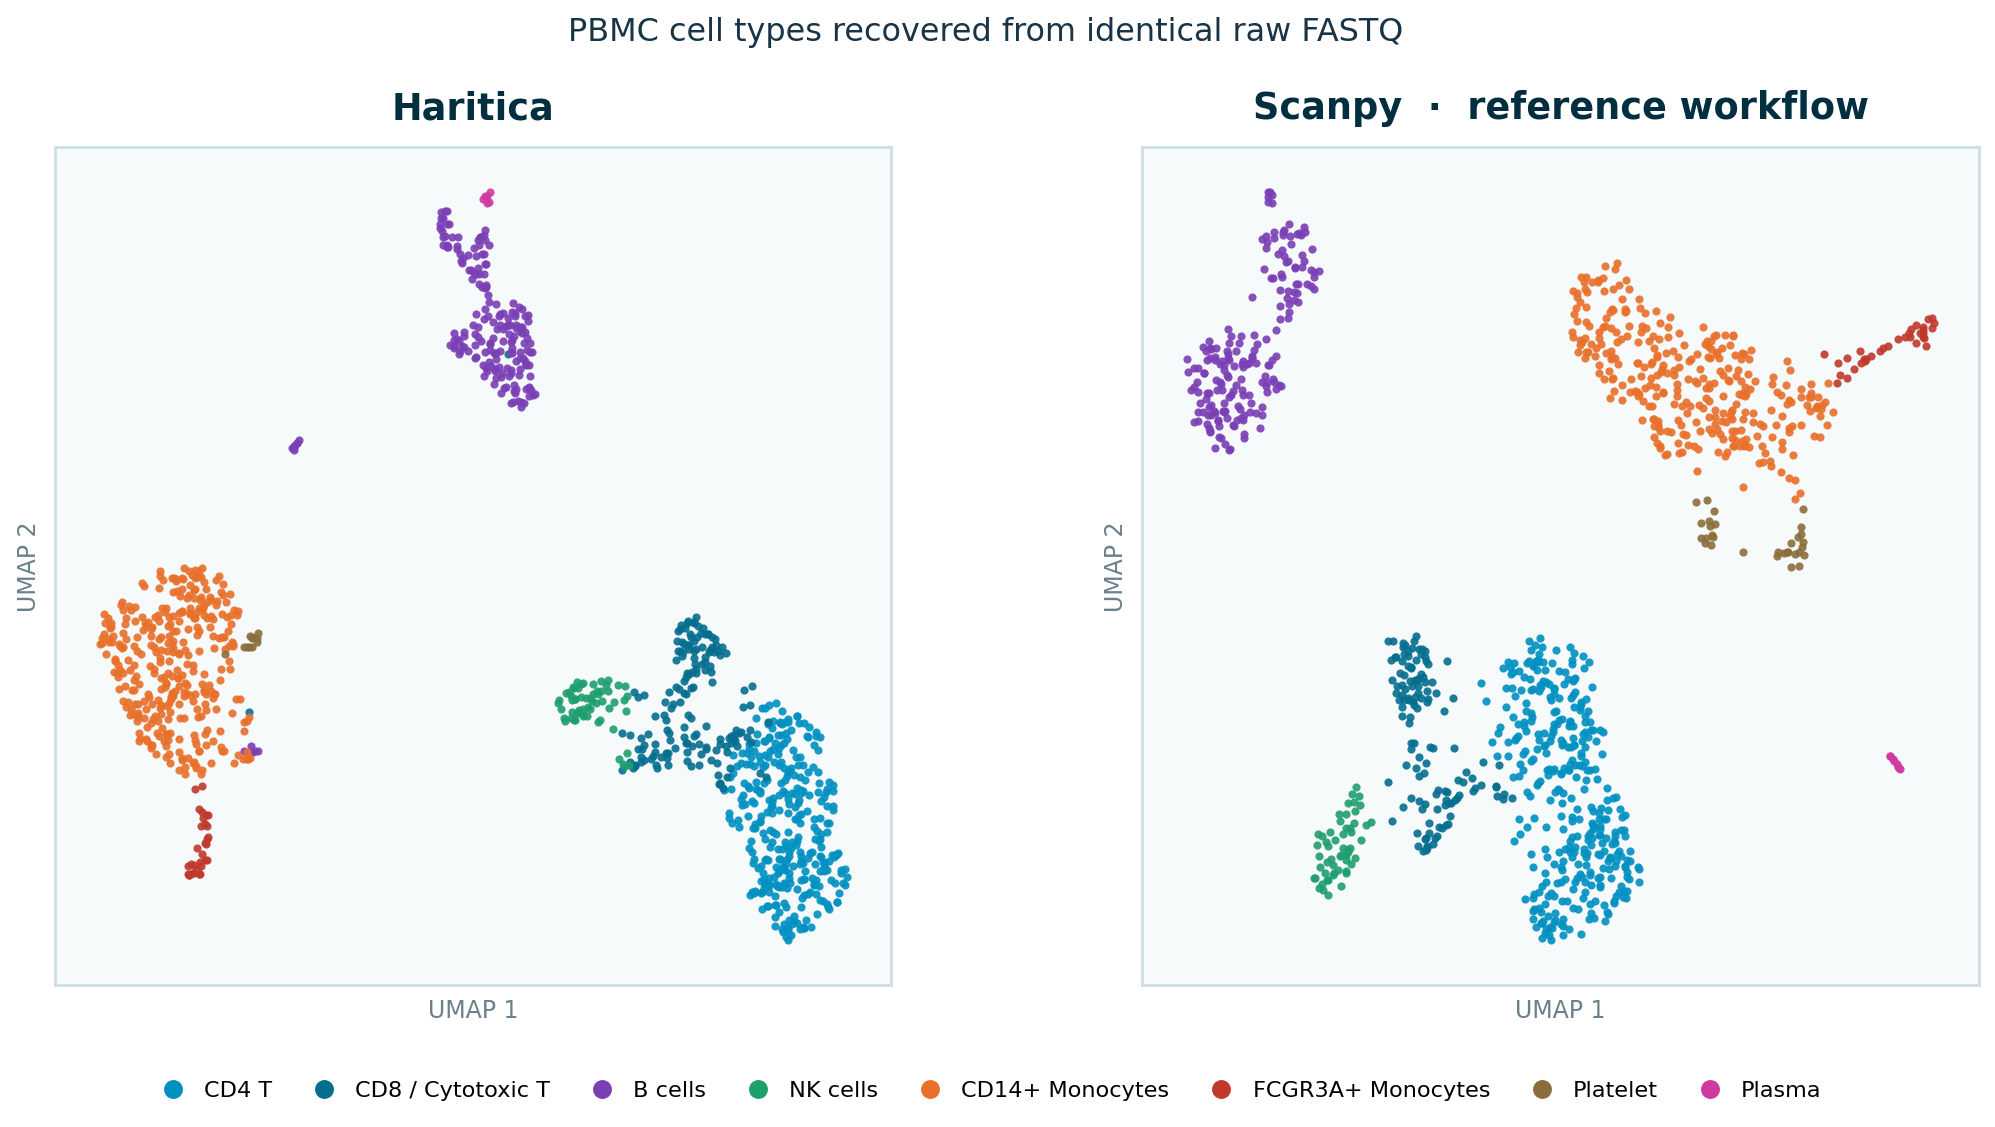
Figure 1. UMAP coloured by assigned cell type, on identical input.
Left: the Haritica app embedding (Leiden run), clusters renamed in-app to their assigned types.
Right: the independent Scanpy reference on the same counts. The same populations occupy the same
regions. (UMAP is a qualitative, stochastic projection — the panels show the same neighbourhoods, never
identical coordinates; all quantitative concordance is computed from labels, Figure 5, not from these
coordinates.)
2.1 The Leiden gallery: distinct, monotone partitions
The clustering gallery sweeps all fifteen resolution panels. Each is a different partition, and the
cluster count rises monotonically with resolution — the signature of a well-behaved sweep. Table 4
lists each swept resolution and its cluster count and Figure 2 plots the same sweep; the full pipeline is
kallisto | bustools, GRCh38, 1,194 cells → 35,720 genes, LogNormalize, PCA,
Leiden, with resolution 0.8 (12 clusters) selected for the downstream analysis.
Table 4. The multi-resolution gallery: each swept resolution and the number of Leiden clusters it produced. Distinct and monotone — the partitions genuinely differ across the sweep.
Resolution
0.1
0.2
0.3
0.4
0.5
0.6
0.7
0.8
0.9
1.0
1.1
1.2
1.3
1.4
1.5
Clusters
4
6
7
7
9
9
10
12
12
13
14
14
14
14
14
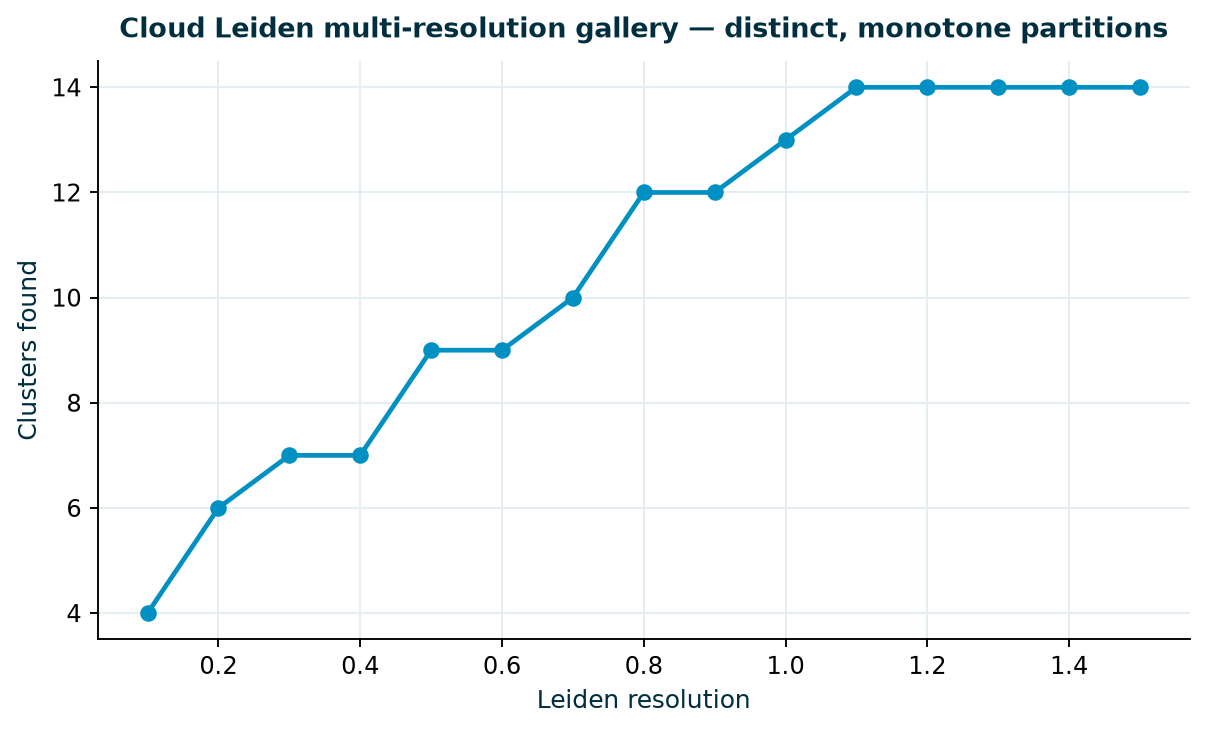
Figure 2. Clusters found versus Leiden resolution. The sweep is monotone
and non-degenerate — the Leiden resolution sweep behaves as expected across the range, 4→14
clusters — not that any one resolution is biologically “true.”
2.2 Quantification vs an external CellRanger matrix
Haritica's kallisto | bustools matrix is compared to 10x's CellRanger matrix of the same FASTQs.
The two call almost the same cells (1,194 vs 1,222, 97.7%; barcode Jaccard 0.96), and on the
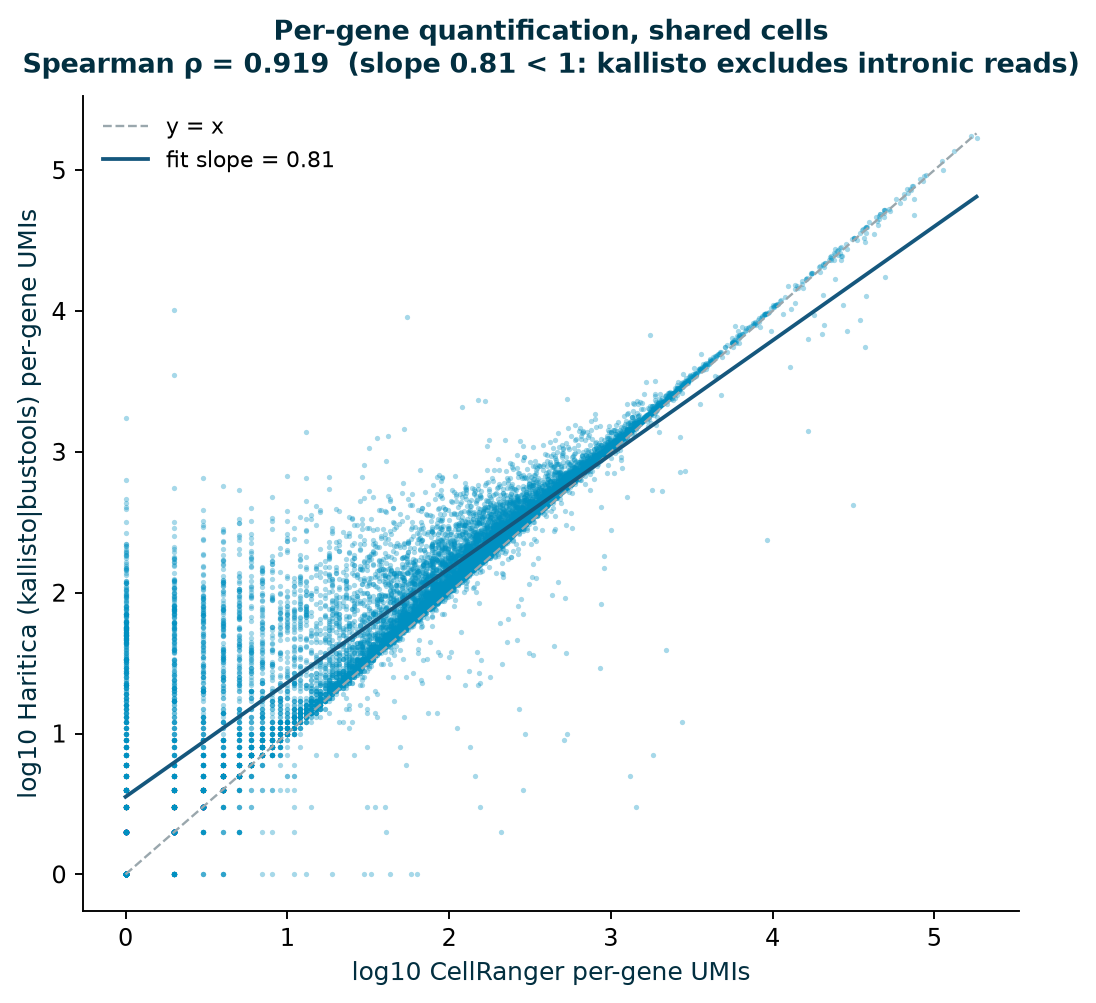
cells both call, per-gene totals correlate at Spearman ρ = 0.92. The log-log slope is
0.81 — below 1 by design: kallisto pseudoaligns to the transcriptome and excludes the
intronic reads CellRanger's splice-aware alignment counts, so Haritica's per-gene magnitudes run
systematically lower. This is the expected, well-documented signature of the two methods, not a discrepancy.
Table 2. Quantification concordance, Haritica kallisto | bustools versus 10x CellRanger, on the same FASTQs.
Metric
Value
Interpretation
Cells called (Haritica / CellRanger)
1,194 / 1,222
97.7% agreement
Barcode Jaccard (all called)
0.958
nearly the same cell set
Shared called barcodes
1,182
basis for the per-gene comparison
Gene join
Ensembl ID
16,103 genes mapped (60.8% of the shared space)
Per-gene Spearman ρ (shared cells)
0.919
strong rank agreement
Log-log fit slope
0.81
<1: kallisto excludes intronic reads (expected)
Per-gene quantification
Barcode-rank (knee)
Figures 3–4.Left: per-gene UMI totals on shared cells
(log-log). The fit slope of 0.81 sits below the y = x line at high counts —
kallisto's systematic, expected exclusion of intronic reads — with tight rank agreement
(ρ = 0.92). Right: barcode-rank (knee) curves; both pipelines' independent
cell-calling lands at ~the same knee (1,194 vs 1,222 cells), so the small Jaccard gap reflects two reasonable
knee cut-points, not a quantification disagreement.
2.3 Per-cell clustering reproducibility
With both pipelines clustering the same 1,111 cells, the right comparison is per-cell agreement, not a
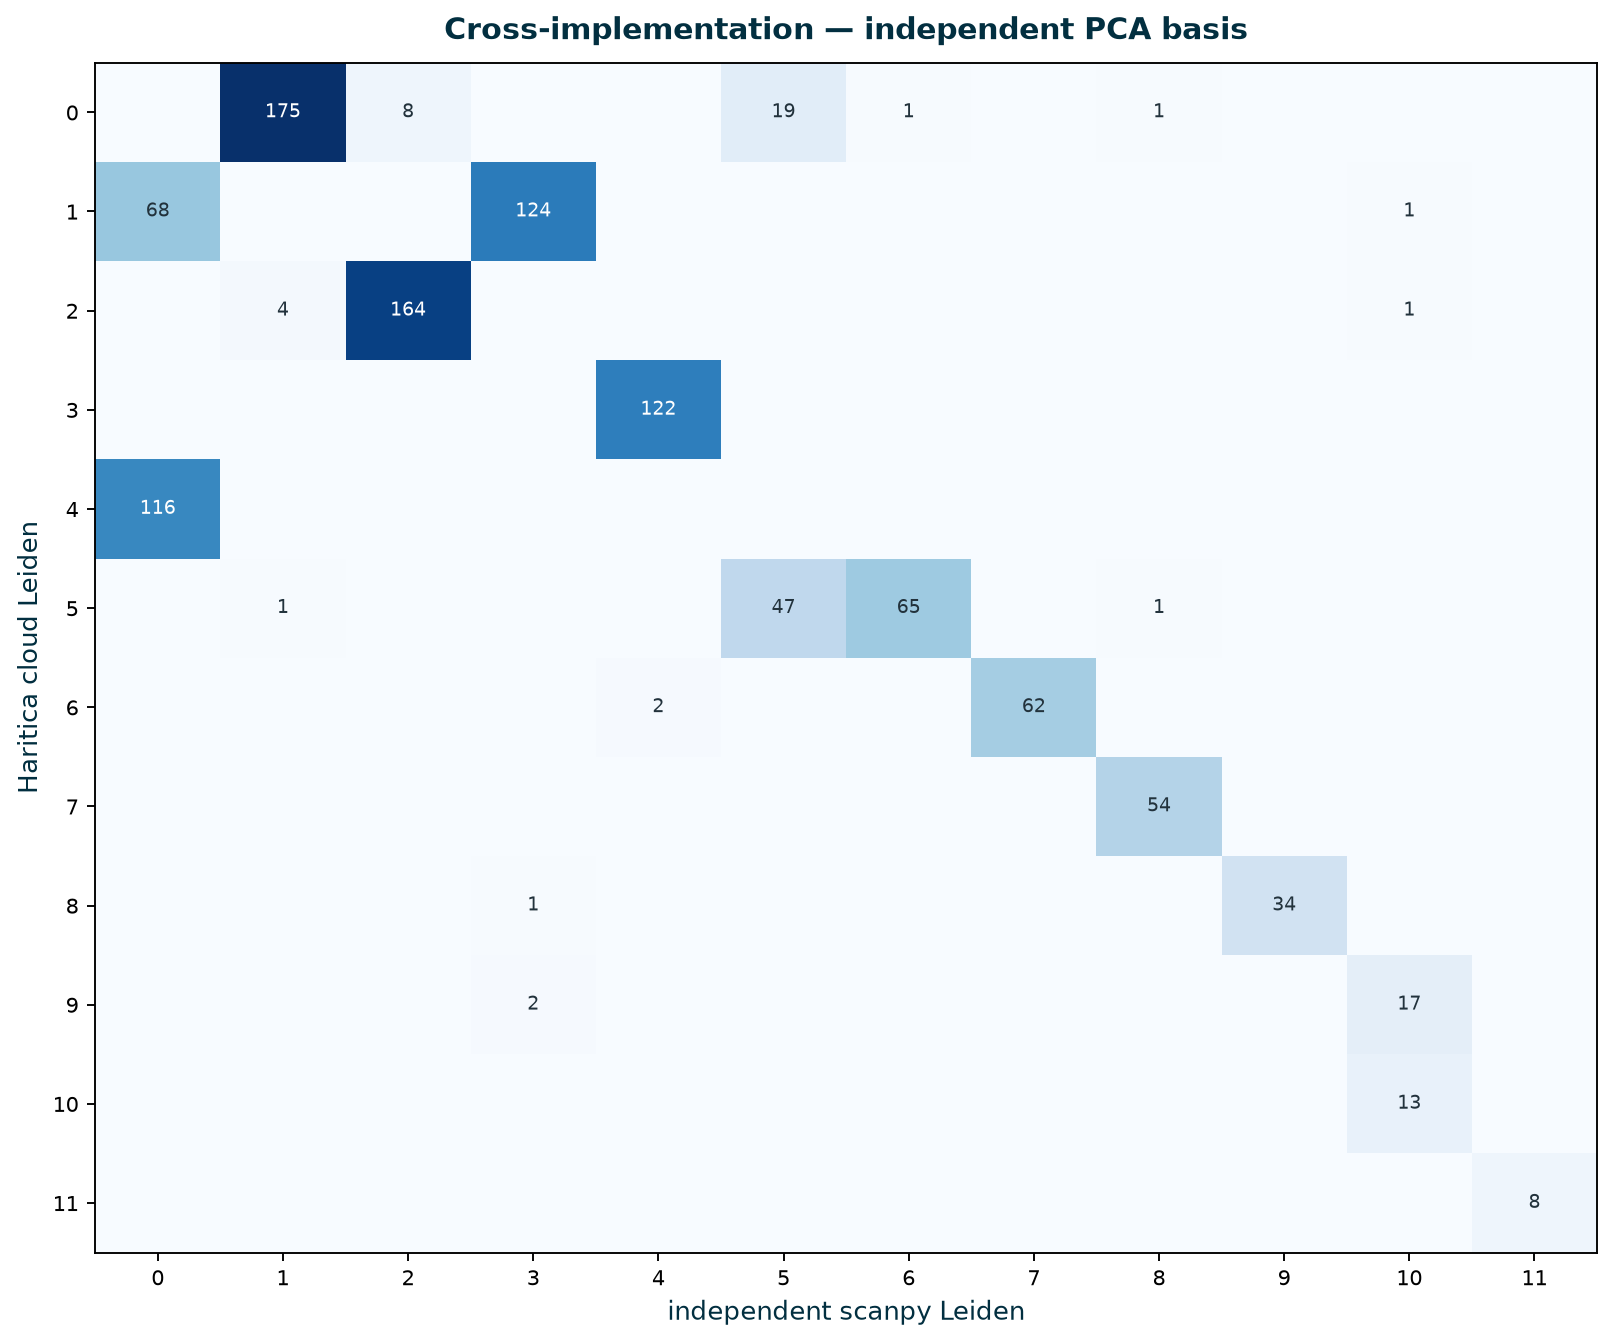
proportion correlation. An independent Scanpy Leiden reproduces Haritica's partition closely: the confusion
matrix is block-structured — each Haritica cluster maps almost entirely onto one independent cluster,
with a few interpretable splits/merges. Adjusted Rand index is 0.75–0.77 and AMI 0.86–0.87,
versus a permutation null of ~0 (p < 0.001) — far above chance, while the residual
captures Leiden's resolution/seed sensitivity rather than a structural disagreement.
Table 3. Per-cell clustering concordance between Haritica's Leiden and an independent Scanpy Leiden (1,111 shared cells). Two comparisons: same embedding (isolates the partition step) and an independent PCA basis (cross-implementation). Permutation null = ARI of randomly shuffled labels (1,000 draws).
Comparison
ARI
AMI
Null ARI (mean±sd)
p
clusters
Same embedding (Haritica's X_pca)
0.753
0.868
0.000±0.002
<0.001
12 vs 10
Independent PCA basis (from counts)
0.771
0.863
0.000±0.002
<0.001
12 vs 12
Figure 5. Confusion matrix of per-cell labels, Haritica Leiden
(rows) versus the independent Scanpy Leiden on an independent PCA basis (columns). Cluster IDs are arbitrary
between runs, so the structure to read is that each row concentrates into one (occasionally two) columns
— a near-permutation block structure (ARI = 0.77). A handful of cells distribute across a
split/merge boundary; these are the small populations where the two runs draw the resolution cut slightly
differently.
2.4 Embedding and cell-type recovery
At resolution 0.8 the twelve Leiden clusters map onto all nine canonical PBMC populations. The
embedding (Figure 1) shows the expected islands — a B-cell cluster, the CD4/CD8 T and NK lymphoid
lobe, and the monocyte/dendritic/platelet myeloid lobe — side by side with the independent Scanpy
reference on the same counts. The Leiden gallery resolves the rare populations — FCGR3A+ monocytes,
dendritic cells, platelets, and a rare plasmacytoid cluster all separate here.
Table 5. Cluster → cell-type assignment (Haritica Leiden, resolution 0.8, 12 clusters, 1,111 cells), with the rank of an EXTERNAL canonical panel within each cluster's unsupervised Wilcoxon DE ranking (the independent biological signal of Arm 3).
Cluster (size)
Cell type
App top markers
External-panel ranks (in unsupervised DE)
0 (204)
CD4 T
IL7R, TRAC, IL32, LDHB, CD3D
IL7R 1, CD3D 5, TCF7 10 (3/4 in top 25)
2 (169)
CD4 T (quiescent)†
TPT1, RPS12, RPS14, RPS6
ranks 62–121 (ribosome-high resting cluster)
5 (114)
CD8 / cytotoxic T
KLRG1, NKG7, GZMA, CCL5
NKG7 2, CCL5 4, GZMK 8 (3/3)
7 (54)
NK cells
KLRF1, KLRD1, GNLY, NKG7
KLRD1 2, GNLY 3, NKG7 4 (4/4)
3 (122)
B cells
IGHD, IGHM, CD37, CD79A
CD79A 4, MS4A1 6, CD79B 8 (4/4)
6 (64)
B cells
CD79A, BANK1, CD79B, MS4A1
CD79A 1, CD79B 3, MS4A1 5 (4/4)
1 (193)
CD14+ monocytes
CPVL, LGALS2, CD14, FGL2
CD14 3, FCN1 18, LYZ 22 (3/4)
4 (116)
CD14+ monocytes
S100A9, S100A8, S100A12, LYZ
S100A8 2, LYZ 5, FCN1 7 (3/4)
8 (35)
FCGR3A+ monocytes
FCGR3A, LST1, AIF1, CSF1R
FCGR3A 1, LST1 2, MS4A7 9 (3/3)
9 (19)
Dendritic
CST3, HLA-DPB1, HLA-DPA1, ITGAX
CST3 1, FCER1A 8 (2/2)
10 (13)
Platelet
CAVIN2, GNG11, TUBB1, PPBP
PPBP 4 (with TUBB1/GNG11 defining)
11 (8)
Plasma / pDC‡
LILRA4, SERPINF1, LRRC26
JCHAIN 21, MZB1 26
† Cluster 2 is a resting/naive CD4 T
partner of cluster 0: its top differential genes are ribosomal (a well-known property of transcriptionally
quiet naive T cells), so the canonical T markers rank lower than the stored cutoff while still defining the
lineage. ‡ The rarest cluster (8 cells) is assigned “Plasma” by the
canonical-marker score (MZB1/JCHAIN), but its very top genes (LILRA4, SERPINF1) are
plasmacytoid-dendritic markers — at eight cells the two rare secretory types are not cleanly separable,
which we report rather than over-call.
2.5 Marker specificity
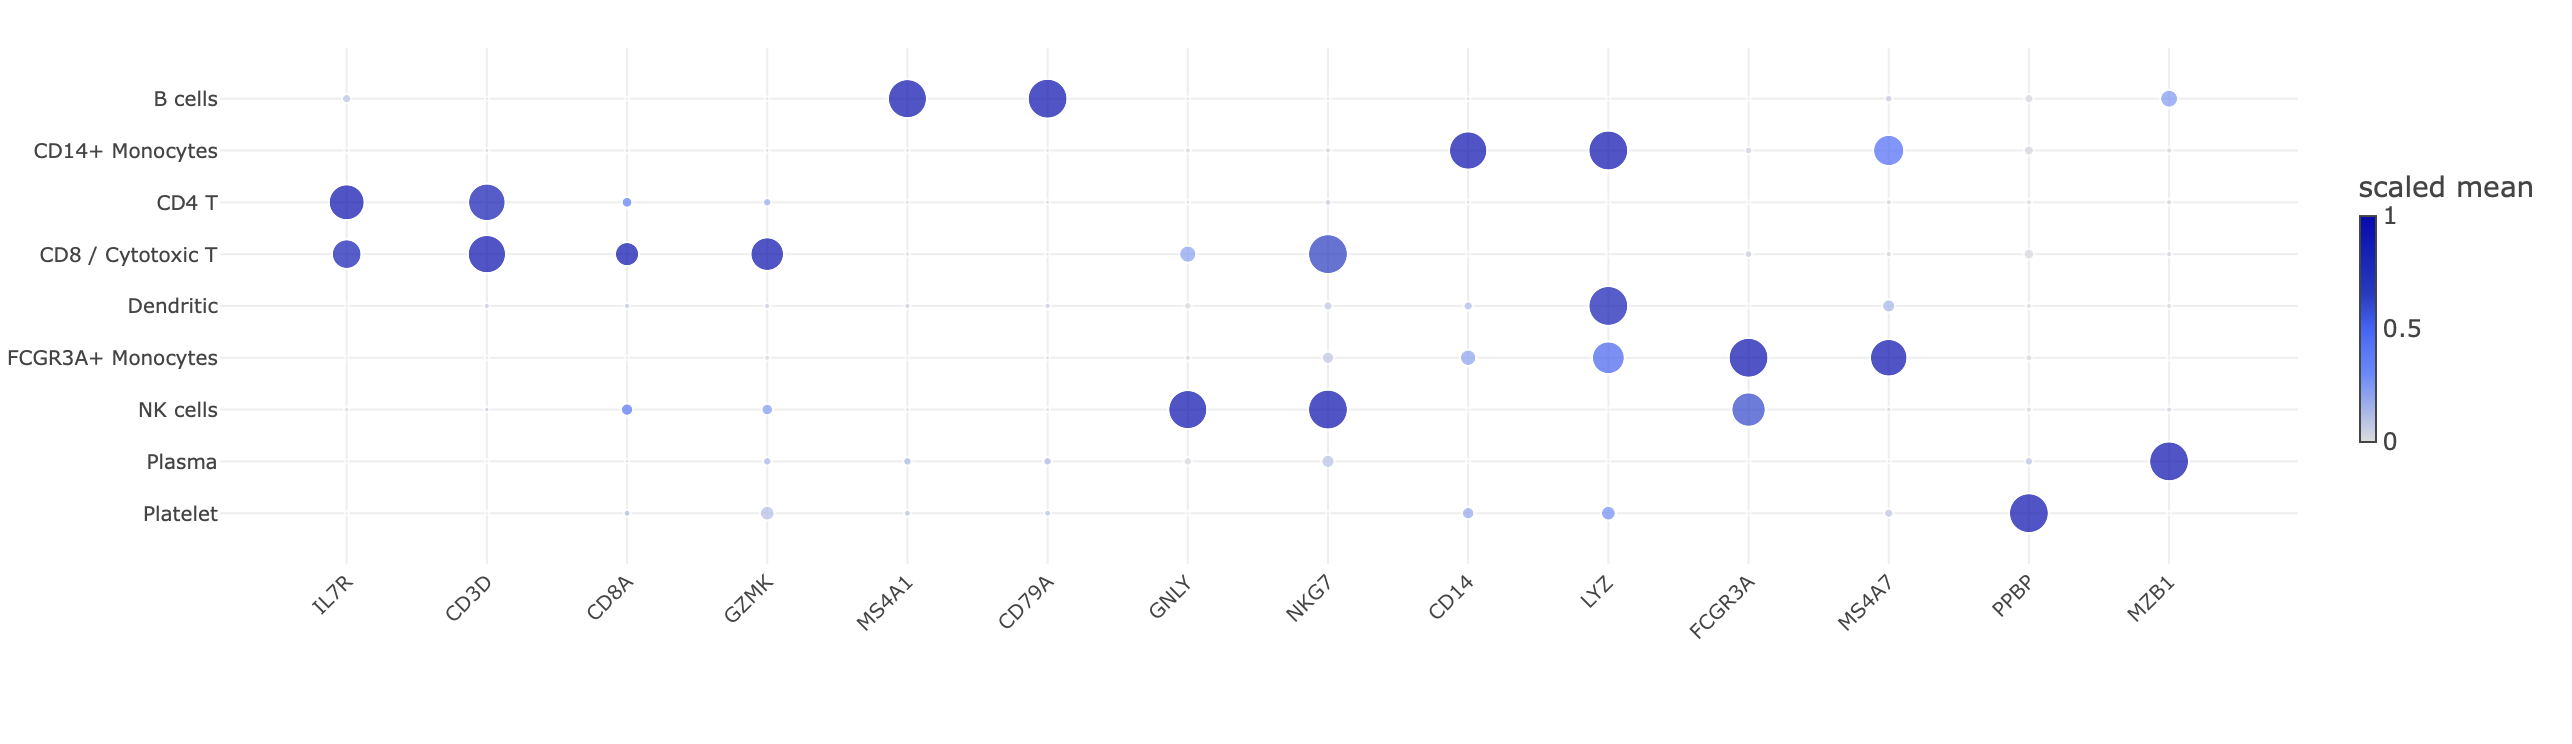
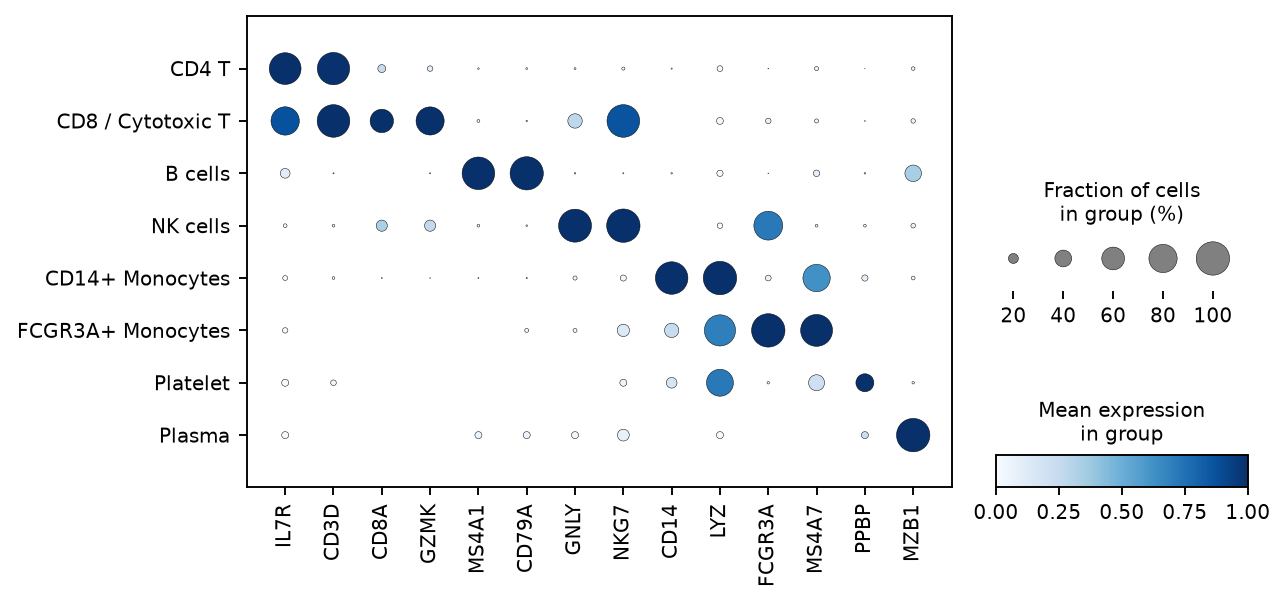
The clusters are biologically correct, not merely statistically distinct. The marker dot plots below put
the same canonical genes on the x-axis and the same cell types on the y-axis for both pipelines, so
they are directly comparable: in each, dot size is the fraction of cells expressing and dot
colour is the per-gene-scaled mean expression. Both show the same clean diagonal — each cell type
lights up its textbook markers (MS4A1/CD79A in B, IL7R/CD3D in CD4 T,
CD8A/GZMK/NKG7 in CD8 T, GNLY/NKG7 in NK, CD14/LYZ in
CD14+ monocytes, FCGR3A/MS4A7 in FCGR3A+ monocytes, PPBP in platelets, MZB1 in
plasma). Quantitatively (Table 5), the external canonical panel lands at the top of each cluster's
unsupervised differential expression (e.g. CD79A rank 1, KLRD1 rank 2,
FCGR3A rank 1, CST3 rank 1) — a signal that never consulted the panel.
Haritica — marker dot plot
Scanpy — reference dot plot
Figure 6. Marker specificity — matched dot plots on identical
axes. Left: Haritica's marker dot plot — the same 14 canonical genes (x) grouped by assigned cell
type (y), dot size = fraction of cells expressing, colour = per-gene scaled mean. Right: the
independent Scanpy sc.pl.dotplot on Haritica's identical counts, same genes and encoding. The two
diagonals agree dot-for-dot. (The reference's Leiden does not split a distinct dendritic cluster, so it shows
eight rows to Haritica's nine — the same granularity difference noted throughout; shared types are
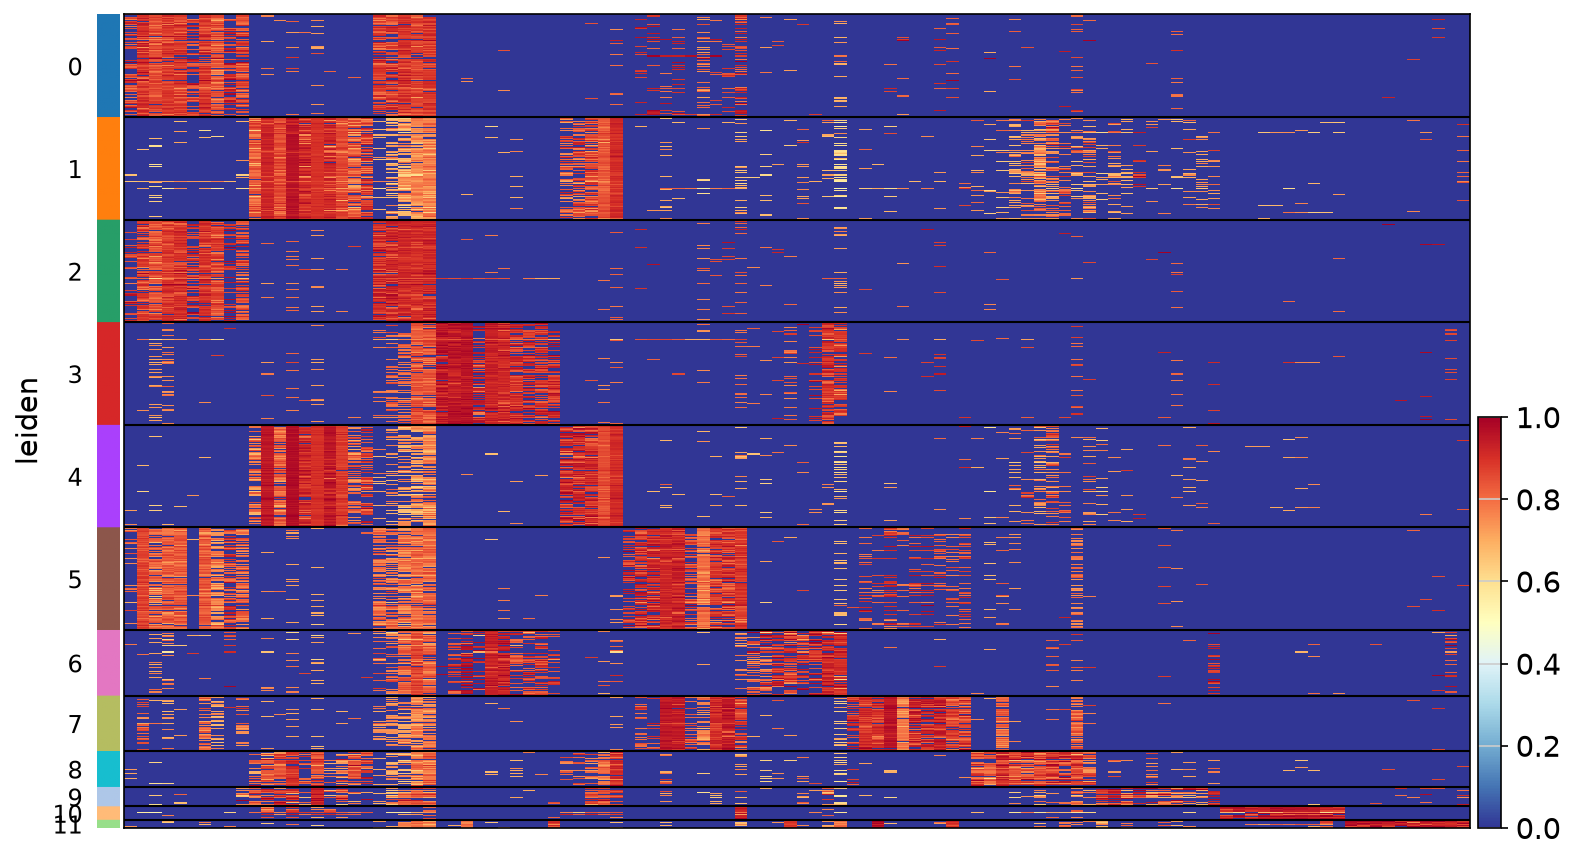
concordant.)Figure 6a. Haritica's in-app marker heatmap (z-scored top genes per
Leiden cluster) — a clean block-diagonal, each of the twelve clusters defined by a distinct gene
set.
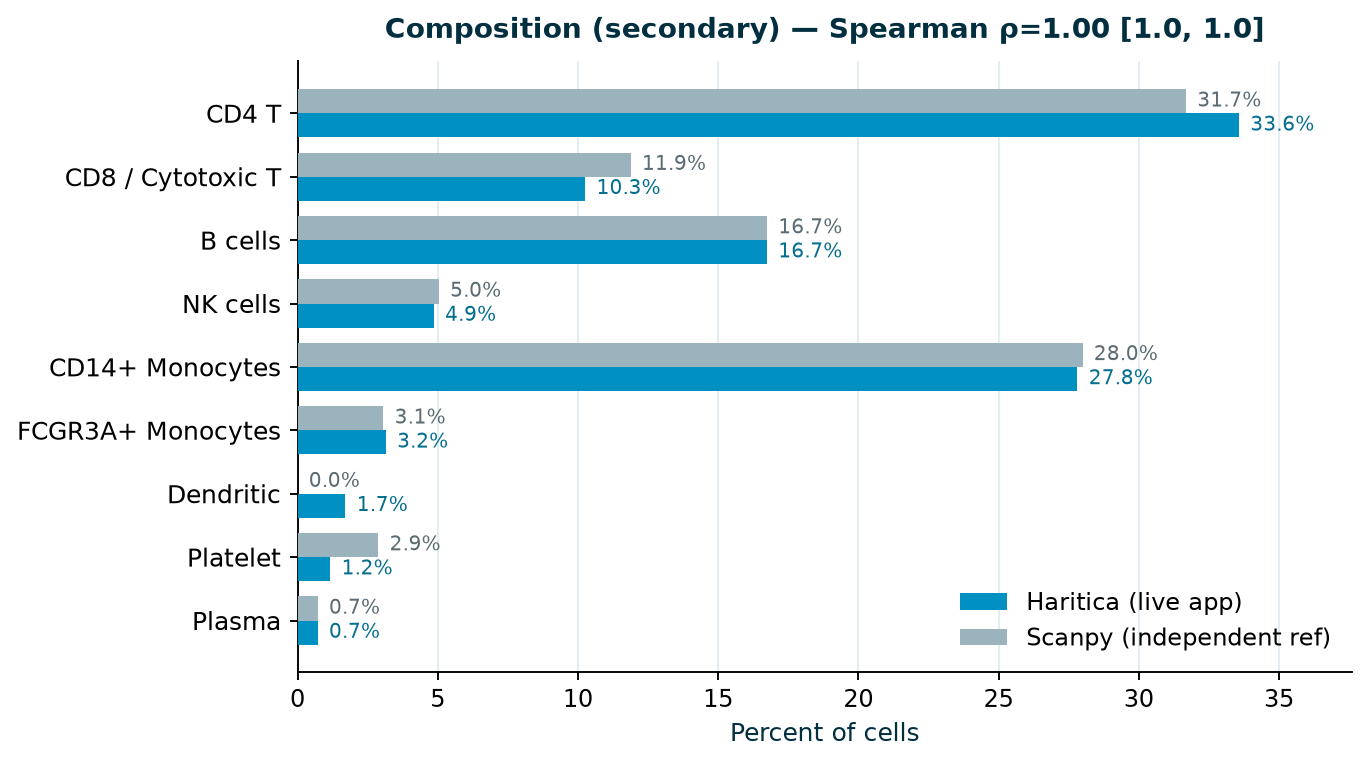
2.6 Composition (secondary)
For completeness, the per-type composition is the expected T-cell-dominant, monocyte-rich PBMC profile:
CD4 T 33.6%, CD14+ monocytes 27.8%, B 16.7%, CD8 T 10.3%, NK 4.9%, FCGR3A+ monocytes 3.2%, dendritic
1.7%, platelet 1.2%, plasma/pDC 0.7%. We report this as secondary because a per-type proportion
correlation is weak: here it evaluates to Spearman 1.0 even though the independent reference's Leiden
assigned the rare dendritic population differently (0% vs 1.7%). Composition correlation is therefore easily
near-perfect by construction; the per-cell confusion matrix and ARI (§2.3) are the load-bearing
concordance results.
Figure 7. Per-cell-type composition (secondary), Haritica versus the
independent Scanpy reference on the identical counts. The major lineages track closely; the rarest types
differ in assignment between the two Leiden runs (see §2.3–2.4). Reported with Spearman + bootstrap
CI rather than a headline Pearson, for the reasons above.
3Data availability and references
All inputs are public. Raw reads: the 10x Genomics
1k PBMCs from a healthy donor, v3 chemistry
(pbmc_1k_v3_fastqs.tar,
two lanes, 66.6 M reads). External quantification reference: the matching 10x
CellRanger filtered matrix
(1,222 cells). Reference genome: Ensembl human GRCh38 (release 110), pseudoalignment index. Cell counts,
cluster labels, and per-gene totals are read directly from the run.