Abstract. The canonical WGCNA tutorial matrix (LiverFemale3600; 3,600 pre-filtered genes across
135 female mouse liver samples with 15 clinical traits, Ghazalpour et al. 2006) was analysed in
Haritica and independently re-analysed with the original R WGCNA package on the identical input. Both
implementations auto-select the same soft-thresholding power (β = 6; scale-free
R2 0.905 versus 0.915), and each surfaces a body-weight co-expression module that is the
other's reciprocal best match: Haritica's cyan module (265 genes) and R's brown module (433 genes) share a
164-gene core (overlap coefficient 0.62; hypergeometric p = 7×10−94),
their eigengenes correlate at r = 0.966 across the 135 samples, and the module–weight
correlation matches (0.606 versus 0.600). Because Haritica's PyWGCNA engine and R WGCNA apply independent
tree-cut and merge heuristics, full module membership is not byte-identical; the validated signal is the
body-weight module together with identical soft-power selection.
1Data and methods
The dataset is LiverFemale3600, the standard worked example distributed with the WGCNA package: 3,600
pre-filtered genes measured across 135 female mouse liver samples, each animal additionally phenotyped for
15 clinical traits including body weight, abdominal and total fat, lipid measures, and bone density
(Ghazalpour et al. 2006 [2]). The data are already-quantified microarray expression, so no alignment
or reference genome is involved. Within Haritica the expression matrix and clinical-trait table were
supplied as CSV and the co-expression network was built with PyWGCNA [3] using the canonical tutorial
settings: Pearson correlation, an unsigned network, soft-thresholding power selected automatically
(scale-free R2 selection cutoff 0.90), minimum module size 30, deepSplit 2, and a merge
threshold (mergeCutHeight) of 0.25. Module–trait relationships were computed as the Pearson
correlation between each module eigengene and each trait.
Table 1. Analysis parameters for the Haritica run.
Parameter
Value
Network type
unsigned
Correlation
Pearson
Soft-thresholding power
auto → 6 (scale-free R2 cutoff 0.90)
Minimum module size
30
deepSplit
2
Merge cut height
0.25
Engine
PyWGCNA
Genes × samples
3,600 × 135
Clinical traits
15
1.1 The reference
The reference is the original R WGCNA package (Langfelder & Horvath, 2008 [1]; version 1.73), the
canonical peer-reviewed implementation of weighted correlation network analysis. It was run on the
identical CSV with matched parameters — adjacency(power = 6, unsigned) →
TOMsimilarity → hclust → cutreeDynamic(deepSplit = 2,
minClusterSize = 30) → mergeCloseModules(cutHeight = 0.25) — using only the
package's own published functions and adding no statistics. The comparison therefore isolates the network
construction and module-detection method from any difference in input. Haritica's PyWGCNA engine is an
independently developed implementation of the same algorithm, so agreement reflects two separate codebases
recovering the same biology rather than a circular comparison. The two implementations apply their own
tree-cut and merge heuristics, so module boundaries — and therefore the exact gene membership and the
total module count — are not expected to be identical; the validated quantity is the body-weight
module, established as a reciprocal best match by gene overlap and eigengene correlation, together with the
soft-power selection.
2Results
Both implementations independently selected the same soft-thresholding power, β = 6,
with closely matched scale-free fit (R2 = 0.905 in Haritica, 0.915 in R) and the same
mean-connectivity decay (Figure 2; Table 2). On the identical 3,600-gene matrix Haritica resolved
14 merged modules and R resolved 17 (from 22 dynamic-cut modules), with a small unassigned (grey)
fraction in both. Module–trait analysis reproduces the defining result of this dataset: each
pipeline's most weight-correlated module is the other's reciprocal best match. Haritica's cyan module
(265 genes, r = 0.606 with body weight, p = 1.3×10⁻¹⁴)
and R's brown module (433 genes, r = 0.600, p = 1.5×10⁻¹⁴)
share a 164-gene core (overlap coefficient 0.62; hypergeometric
p = 7×10−94; Figures 1 and 9). Their eigengenes — the
first-principal-component summary each module stands for — correlate at r = 0.966
across all 135 samples (Figure 8), identifying them as the same co-expression signal independent of
where each tool draws the module boundary. The same module also tracks the body-fat traits in both
pipelines (cyan–abdominal fat 0.52, cyan–total fat 0.54). The remaining gene-count
difference reflects boundary placement: R's additional brown genes still correlate on average 0.575 with
the cyan signal (versus 0.325 for random genes), so they are borderline members below Haritica's cutoff
rather than different biology. Module-colour names are assigned independently by size rank in each tool,
so correspondence is established by gene membership, not by the colour label (R's own unrelated "cyan"
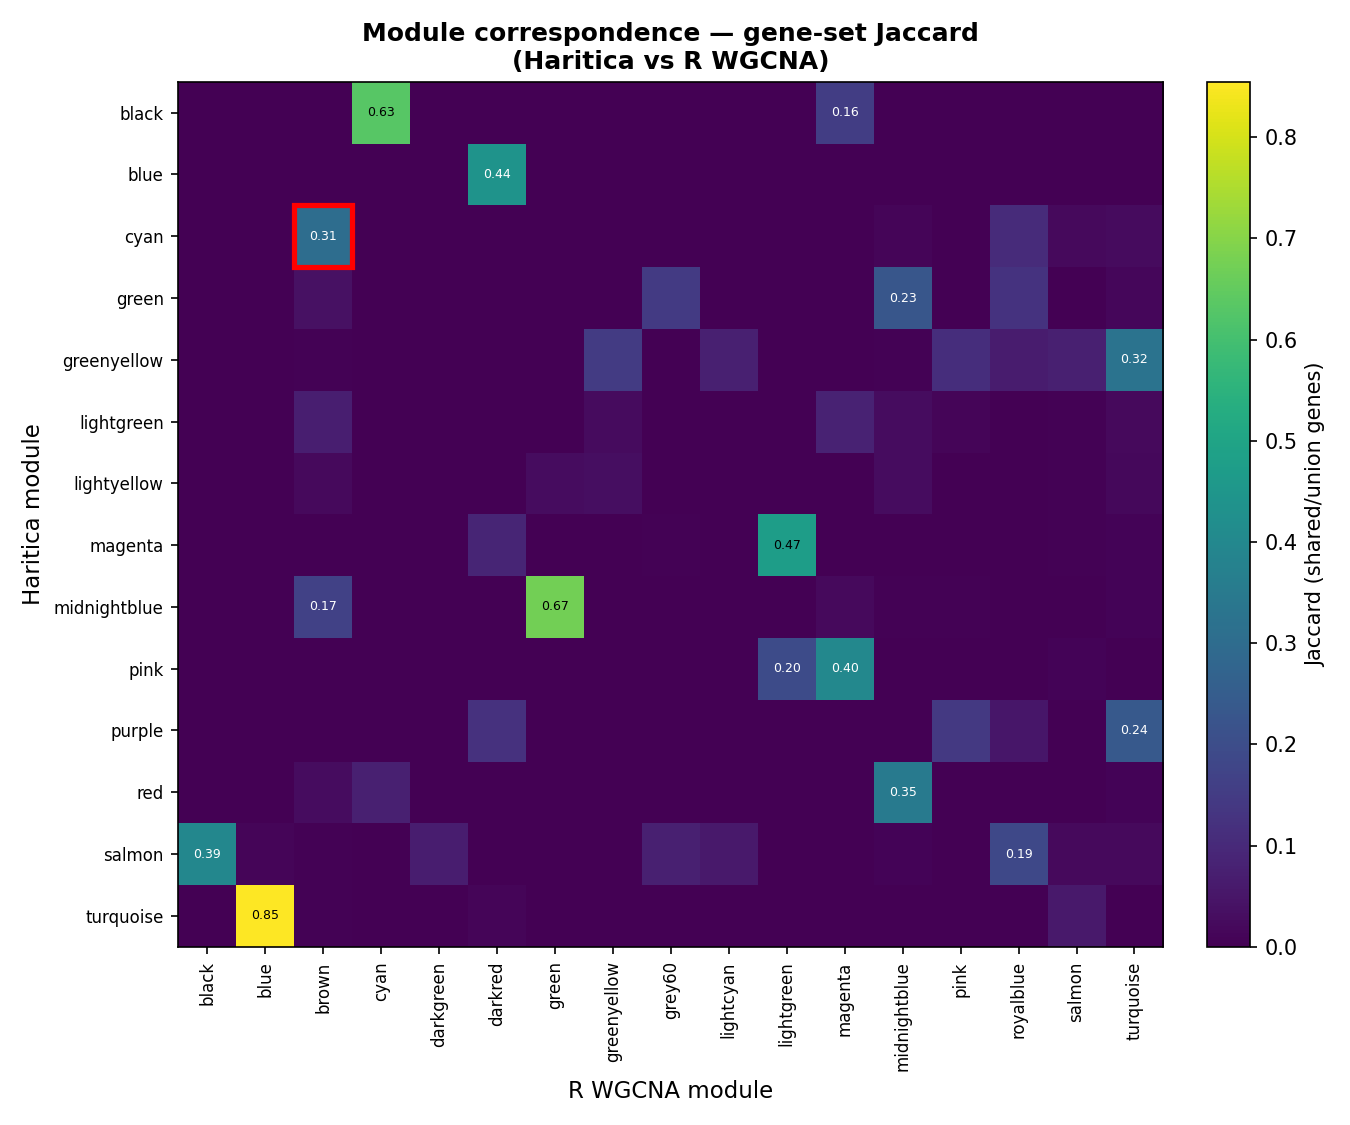
module correlates −0.02 with weight). Across the full networks, 3 of 14 Haritica modules reach a
tight one-to-one match by Jaccard index (turquoise–blue 0.85, midnightblue–green 0.67,
black–cyan 0.63); the remainder split or merge differently, the expected outcome between two
independent implementations.
Table 2. Concordance between Haritica (PyWGCNA) and R WGCNA on the identical matrix.
Quantity
R WGCNA
Haritica
Genes × samples
3,600 × 135
3,600 × 135
Soft-threshold power (auto)
6
6
Scale-free R2 at β = 6
0.915
0.905
Modules (dynamic-cut → merged)
22 → 17
— → 14
Strongest weight module
brown (433)
cyan (265)
shared core genes
164 · overlap 0.62 · p = 7×10−94
module-eigengene r
0.966
Weight-module trait r
0.600
0.606
Module ↔ body fat
yes (brown)
yes (cyan)
Tight 1:1 module matches (Jaccard > 0.6)
3 of 14
Haritica
R WGCNA — reference
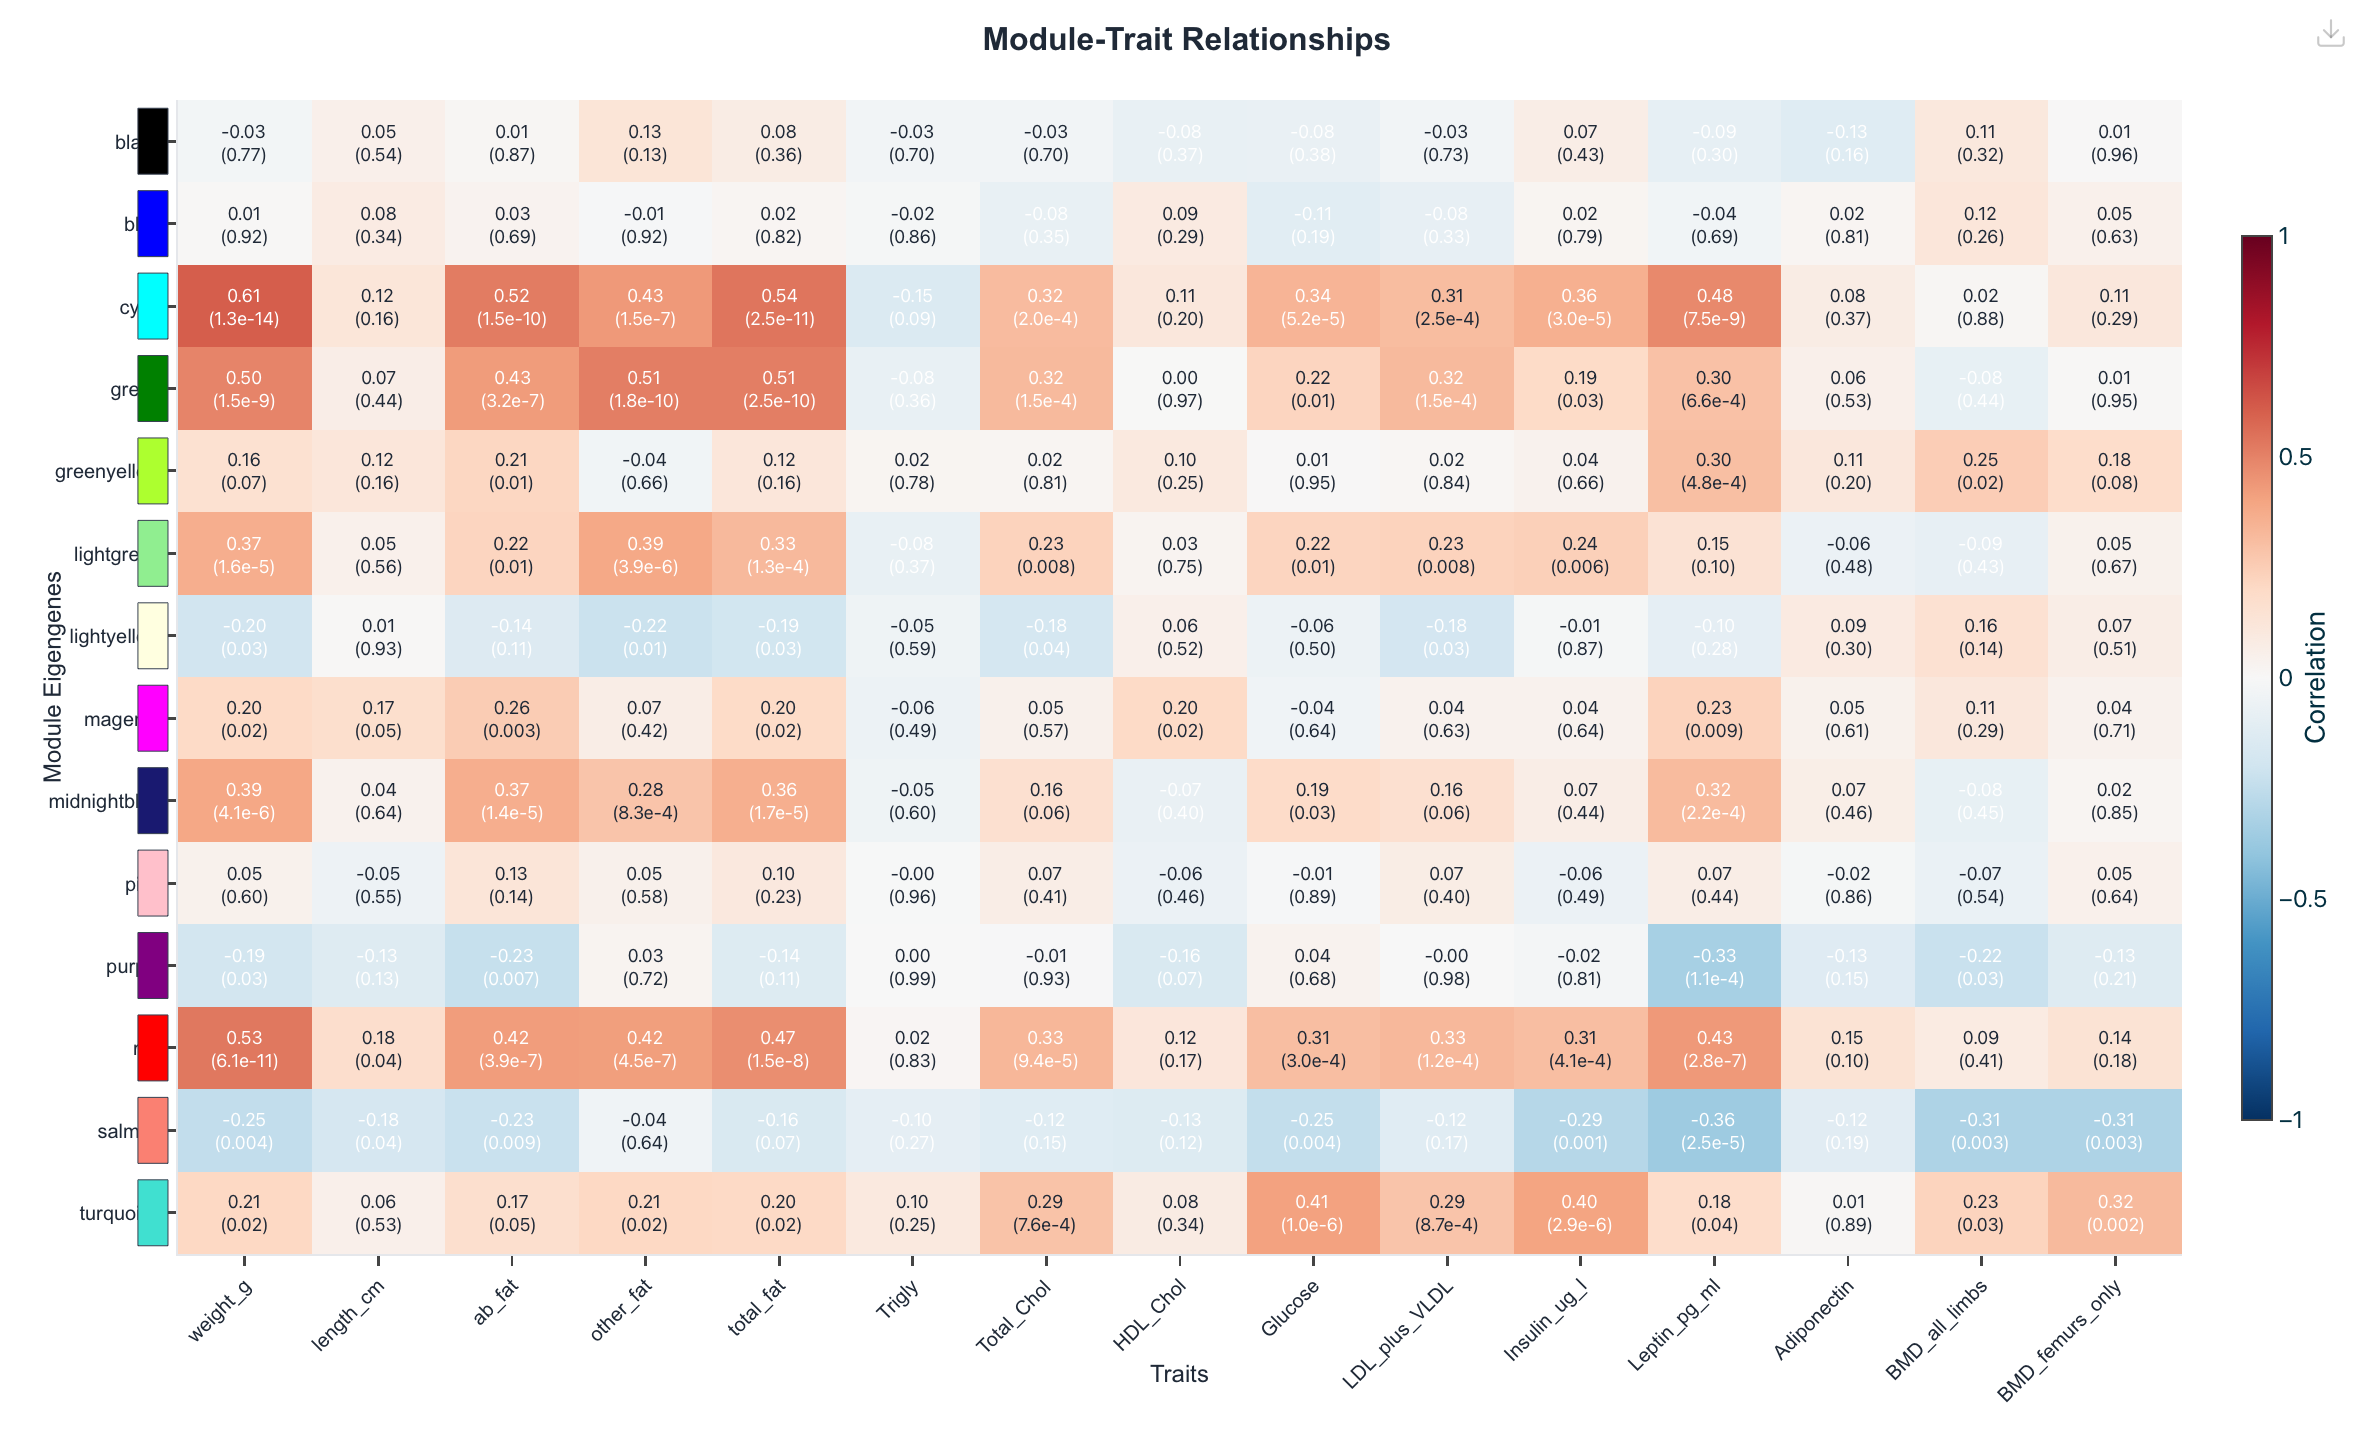
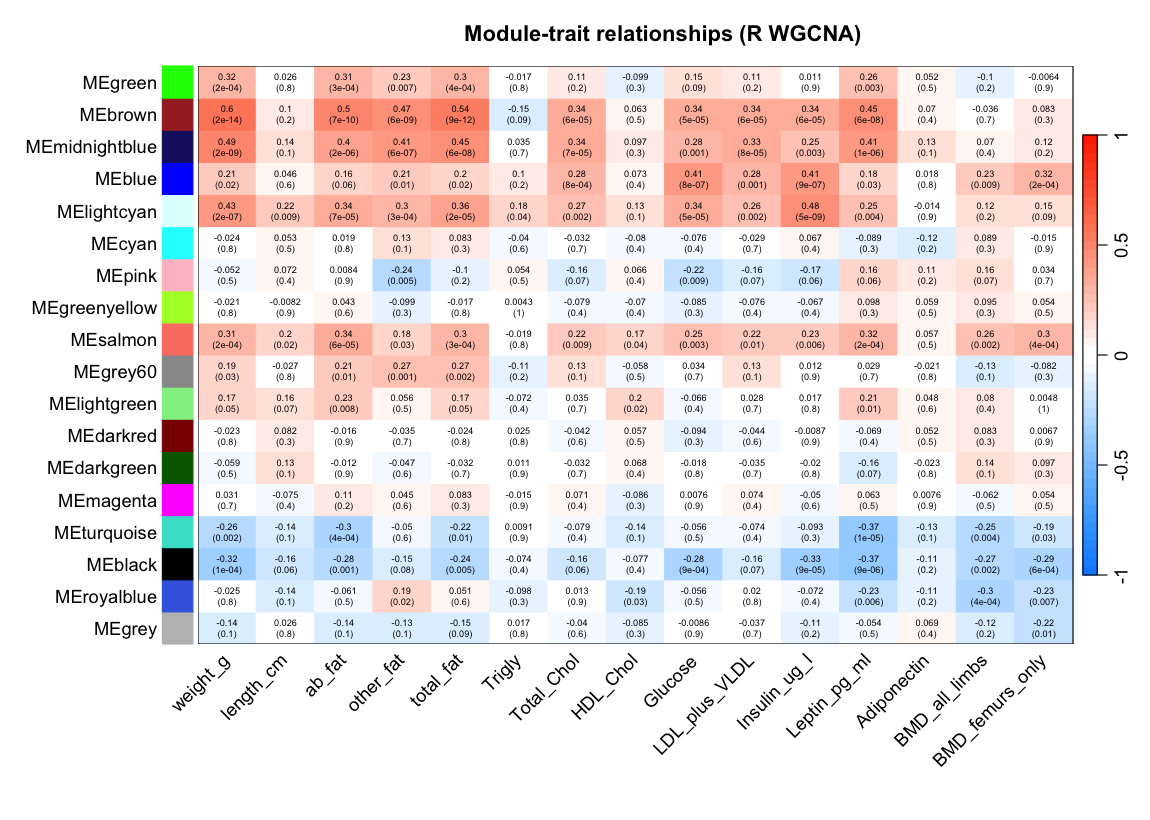
Figure 1. Module–trait relationships: each row is a module
eigengene, each column a clinical trait, each cell their Pearson correlation. Haritica's cyan row is
strongest against body weight (0.606), abdominal fat and total fat; R's brown row is the corresponding
strongest weight/fat module (0.600). Pearson, unsigned, β = 6.
Haritica
R WGCNA — reference
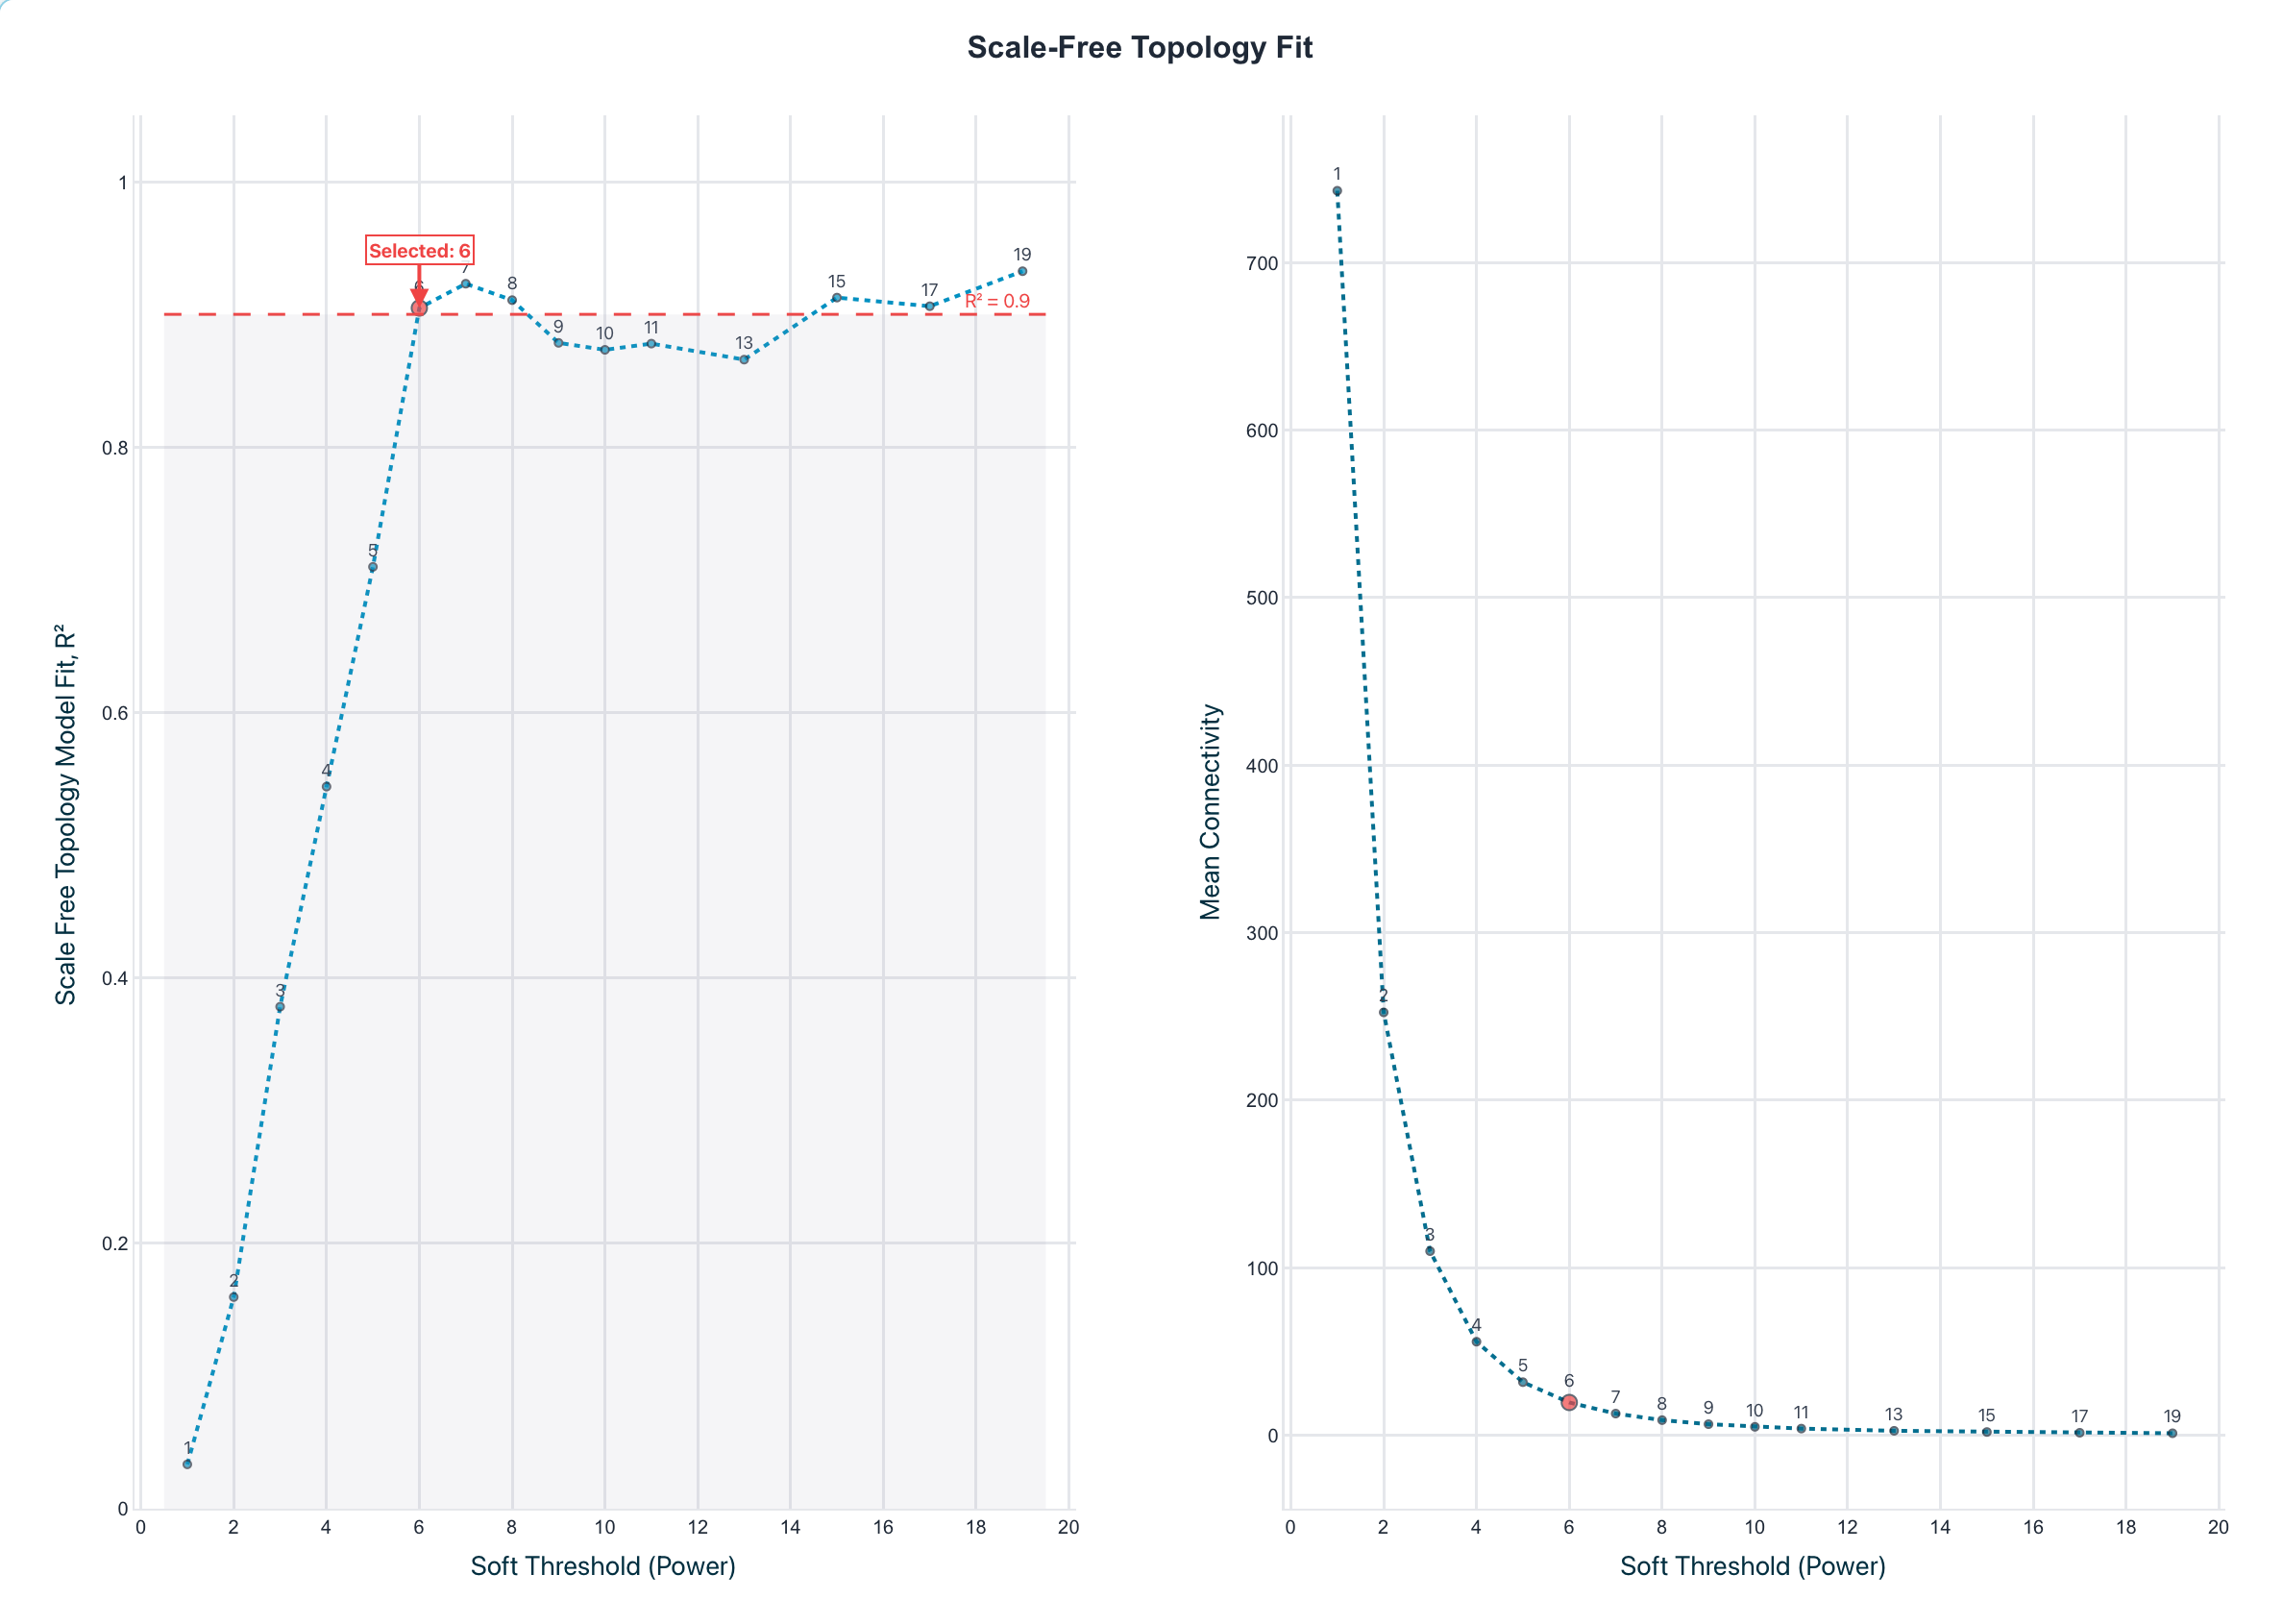
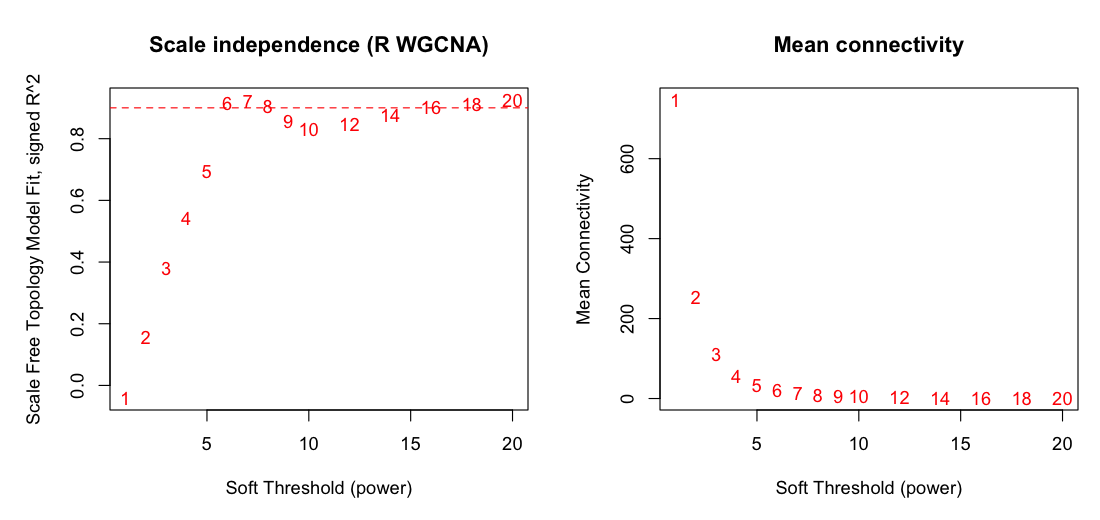
Figure 2. Soft-thresholding power selection. Scale-free-topology
fit (R2) versus candidate power; the lowest power clearing the threshold is chosen. Both land on
β = 6 (R2 0.905 versus 0.915) with matching mean-connectivity decay.
Haritica's plot marks the 0.85 recommended guide line; the selection threshold was 0.90.
Haritica
R WGCNA — reference
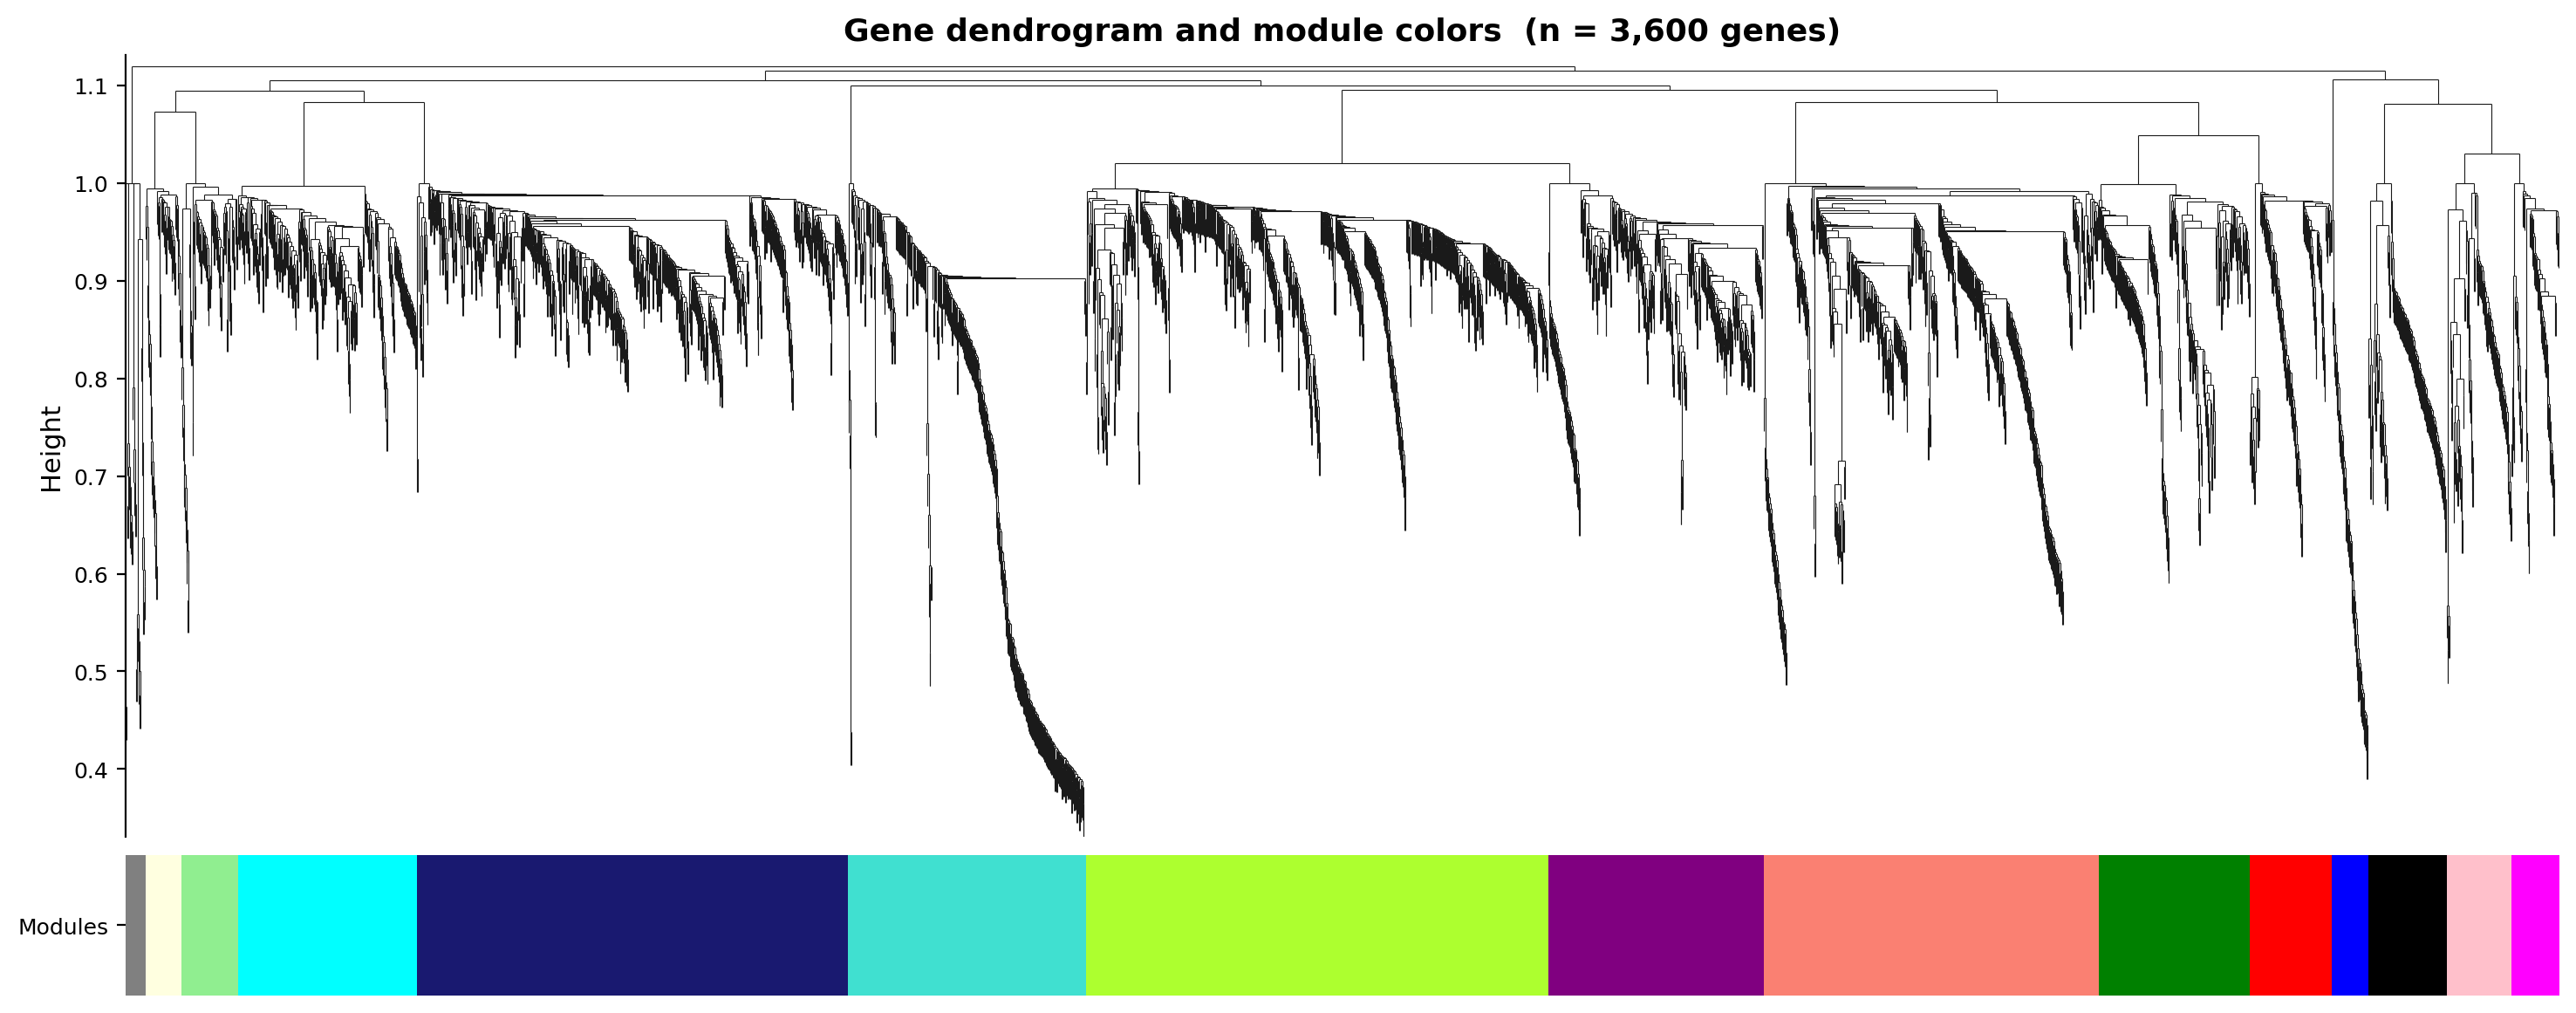
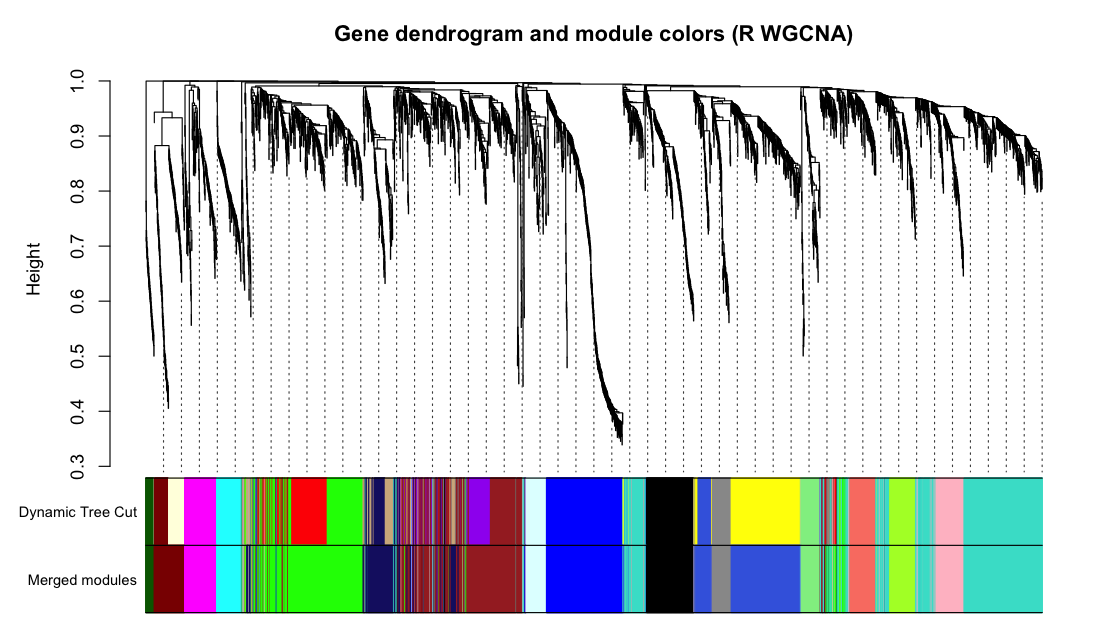
Figure 3. Gene dendrogram with module colours. Genes are clustered
on topological-overlap dissimilarity and assigned to modules by dynamic tree cut (minModuleSize 30,
deepSplit 2, merge cut 0.25). The same large branches and module-colour mosaic appear in both;
Haritica yields 14 merged modules, R 22 dynamic-cut modules merged to 17 (both rows shown).
Haritica
R WGCNA — reference
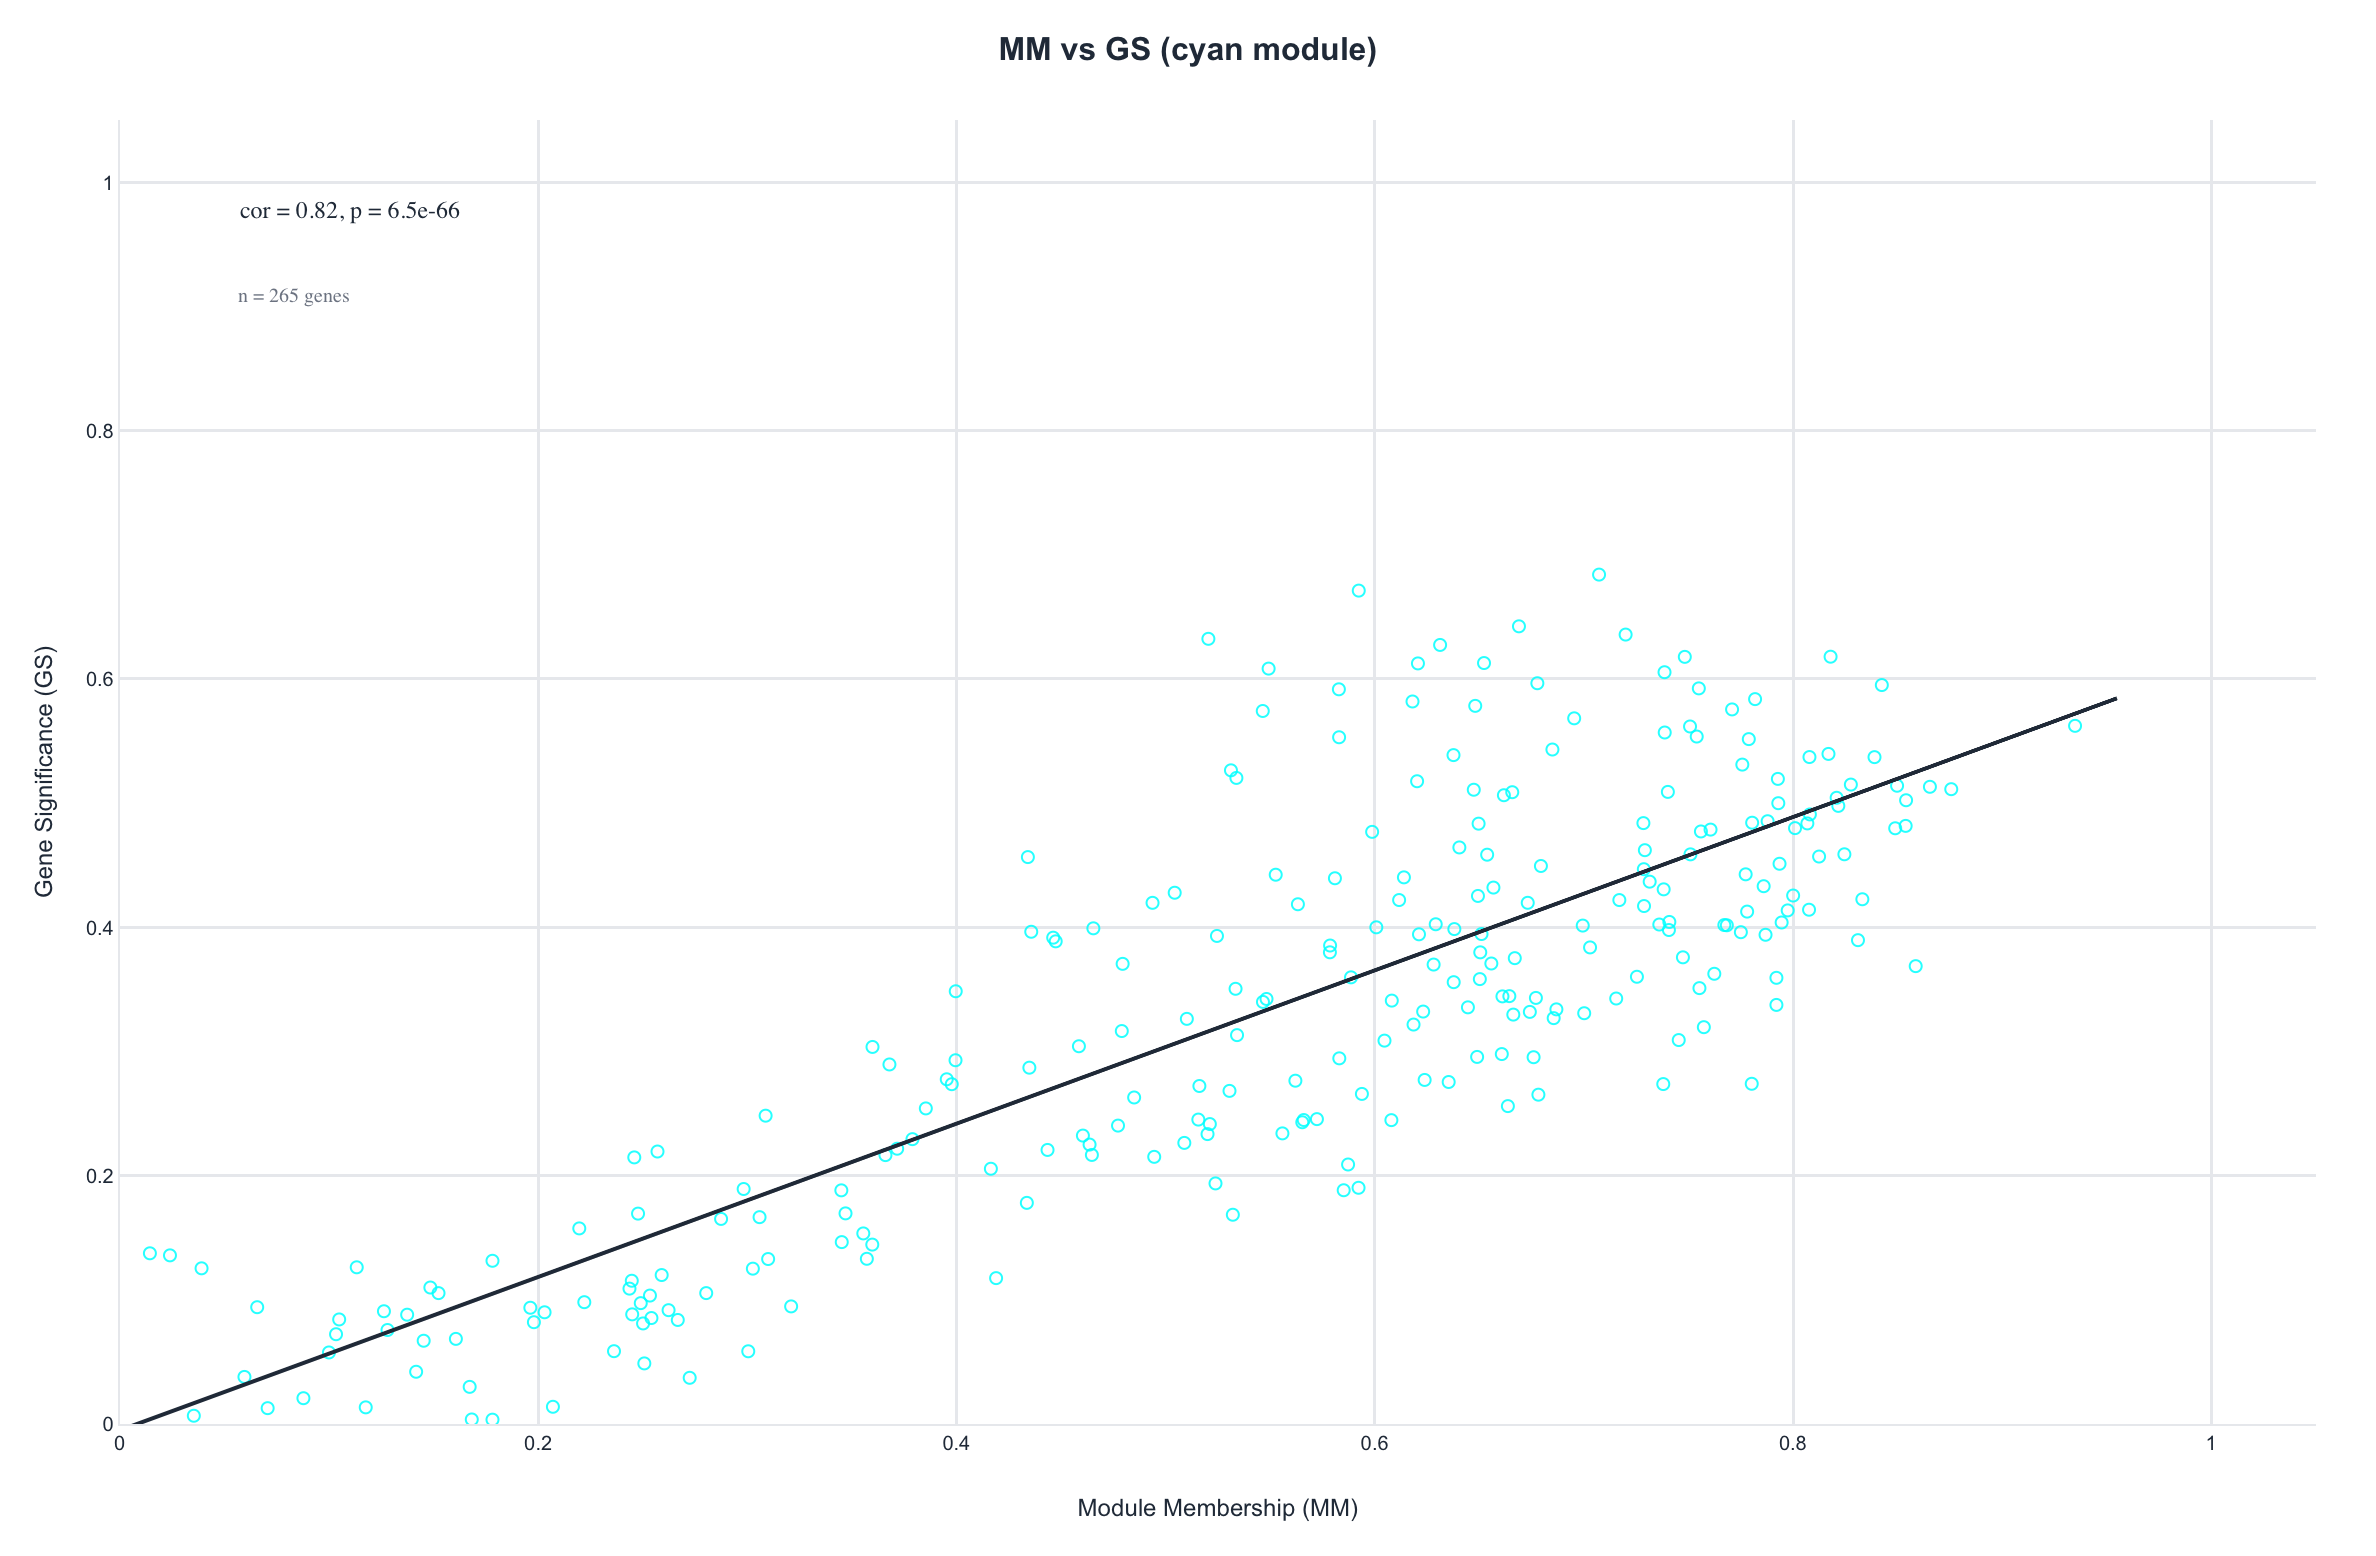
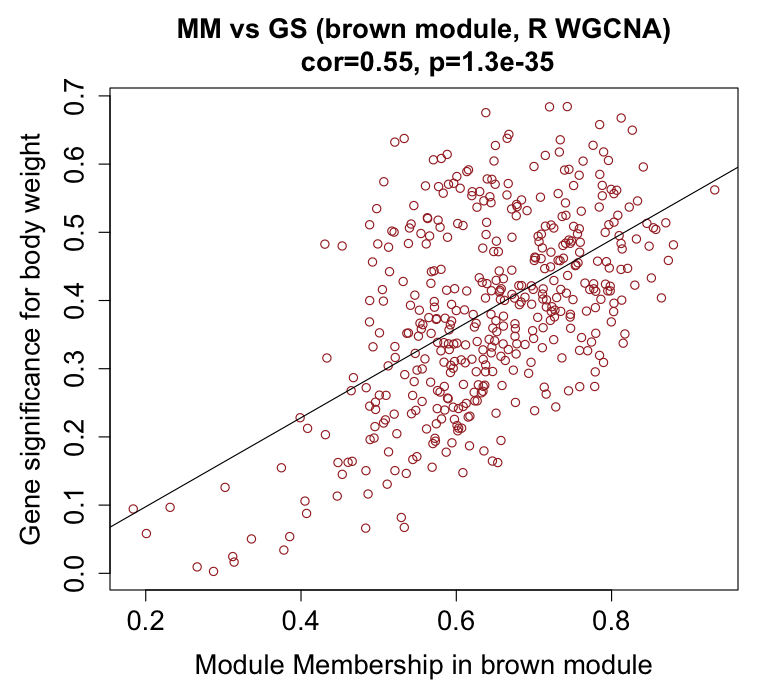
Figure 4. Gene significance versus module membership for the
weight module. A gene's membership (|correlation| to the module eigengene) tracks its significance
(|correlation| with body weight), the signature of a genuine trait module. Both show a clear positive
slope; the coefficients differ (cyan 0.82, n = 265; brown 0.55, n = 433)
because the modules are different sizes with different edge membership.
Haritica
R WGCNA — reference
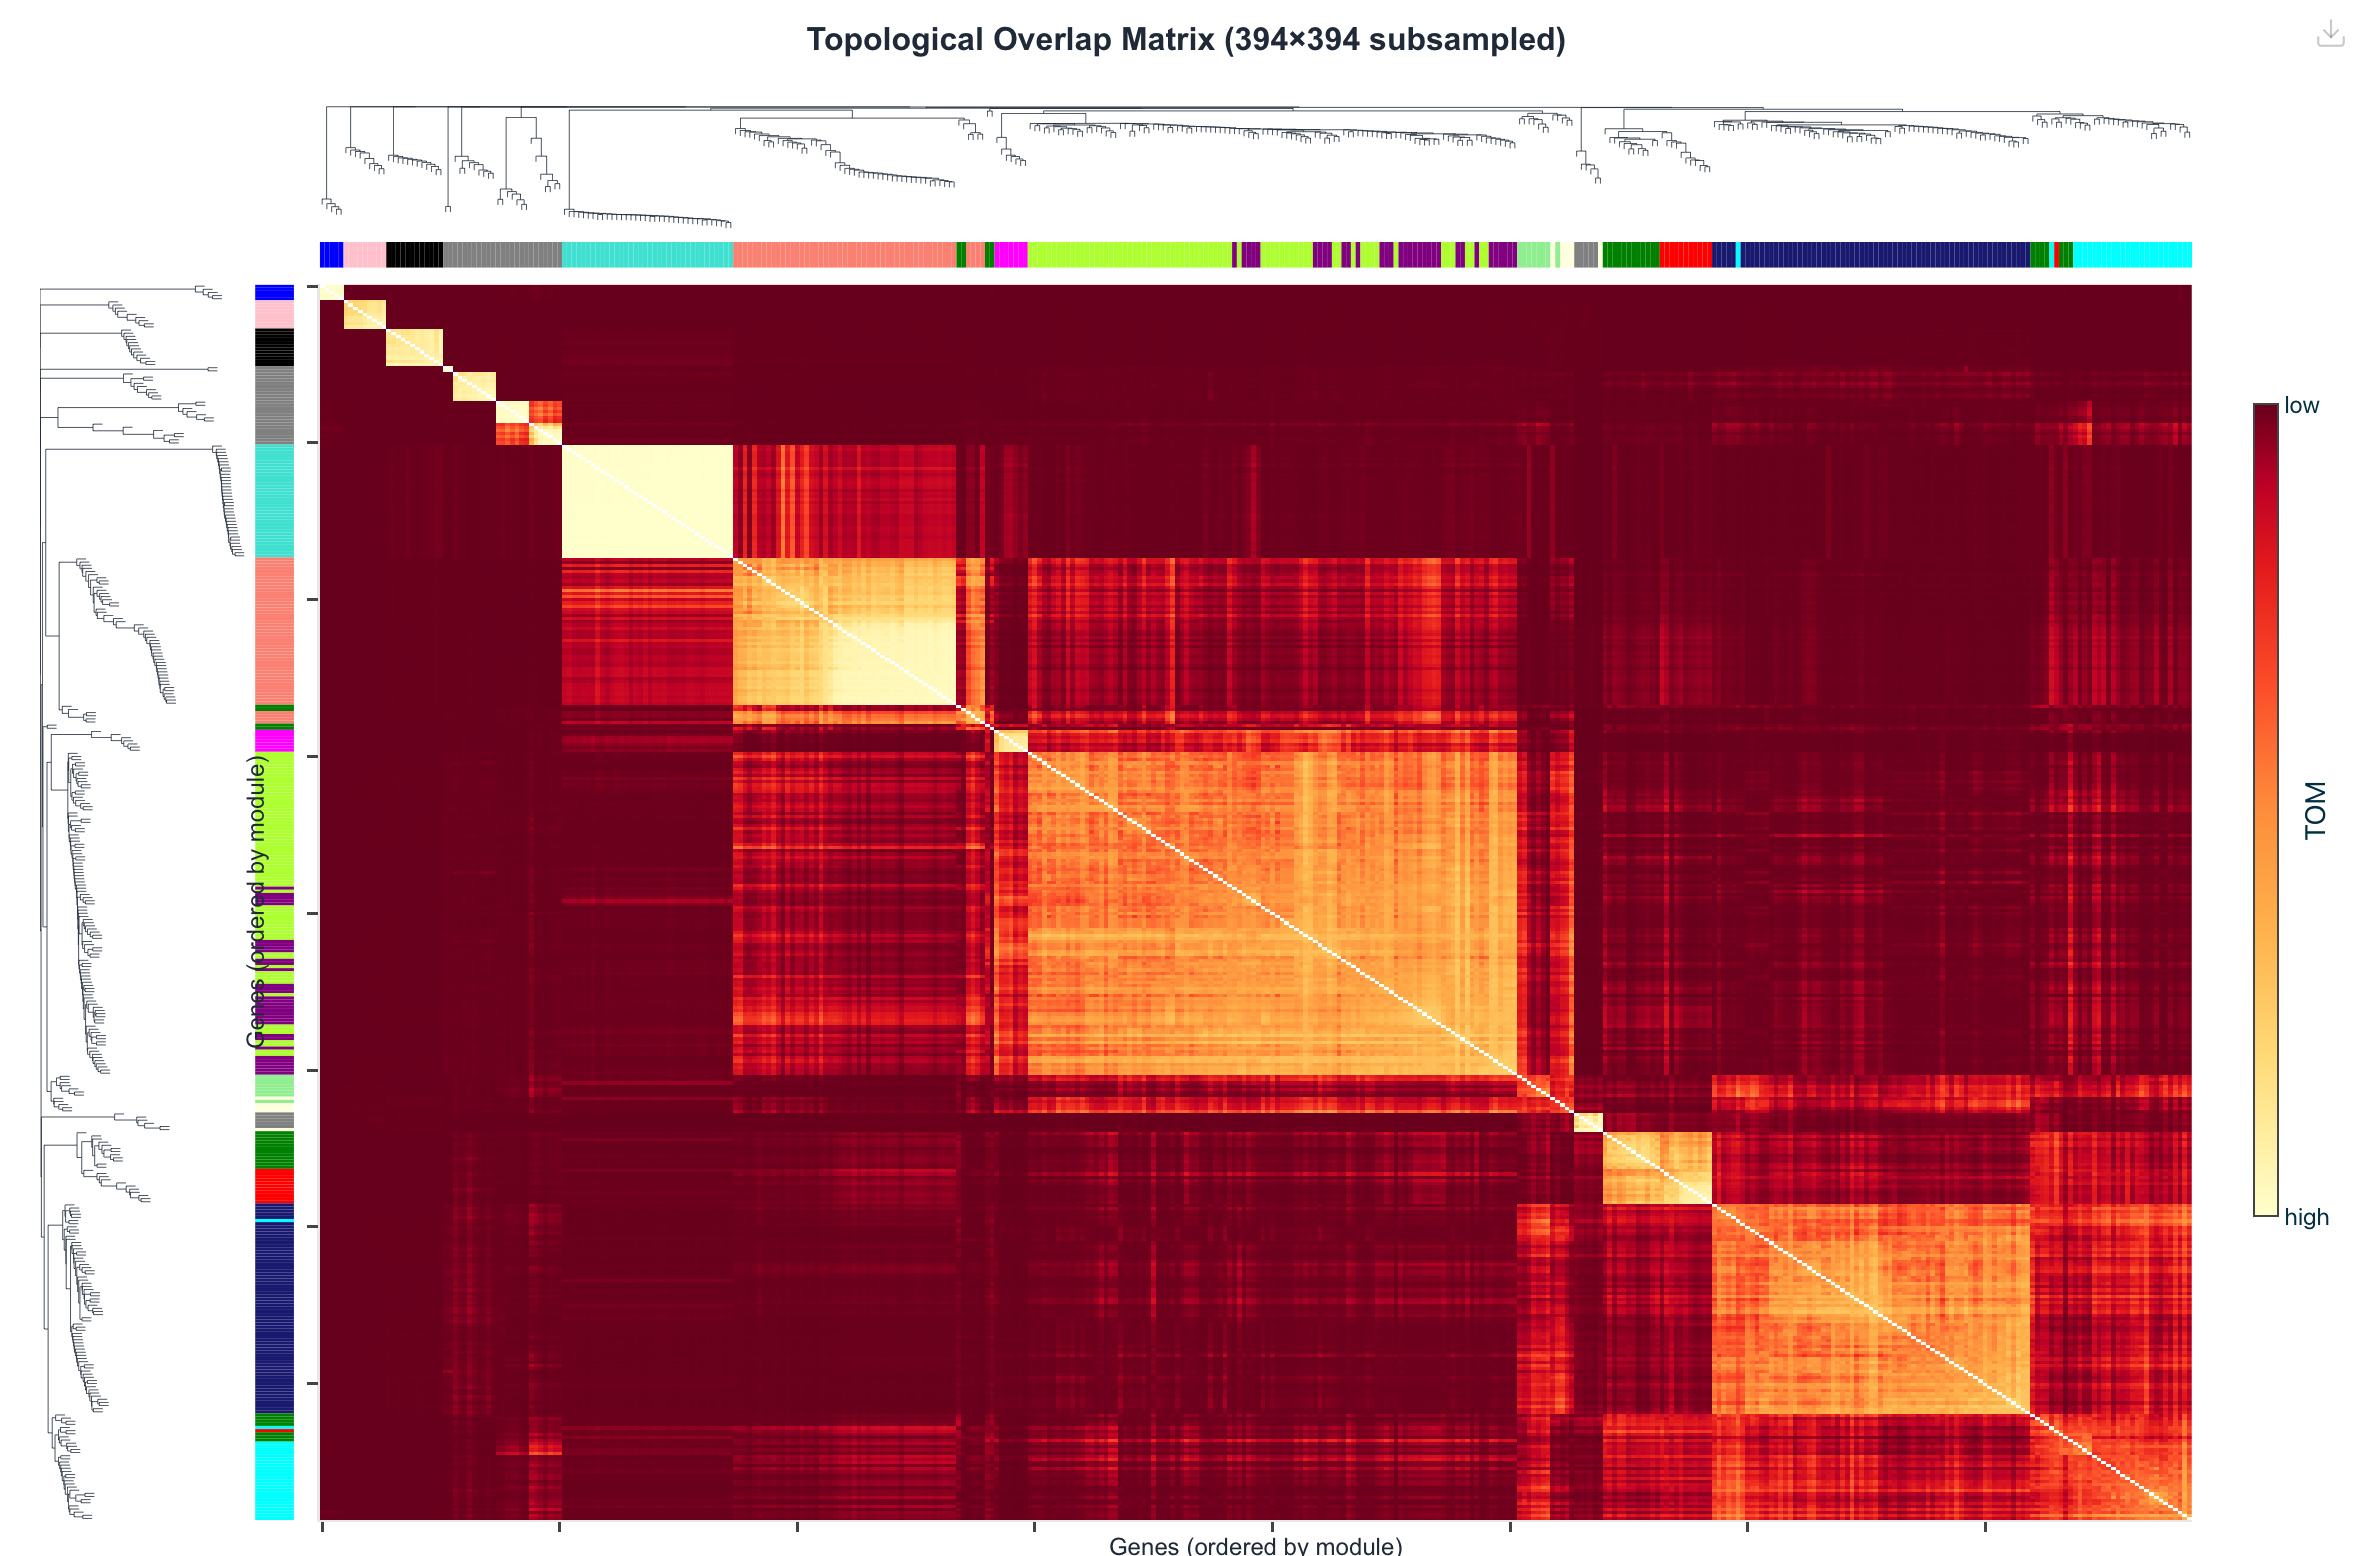
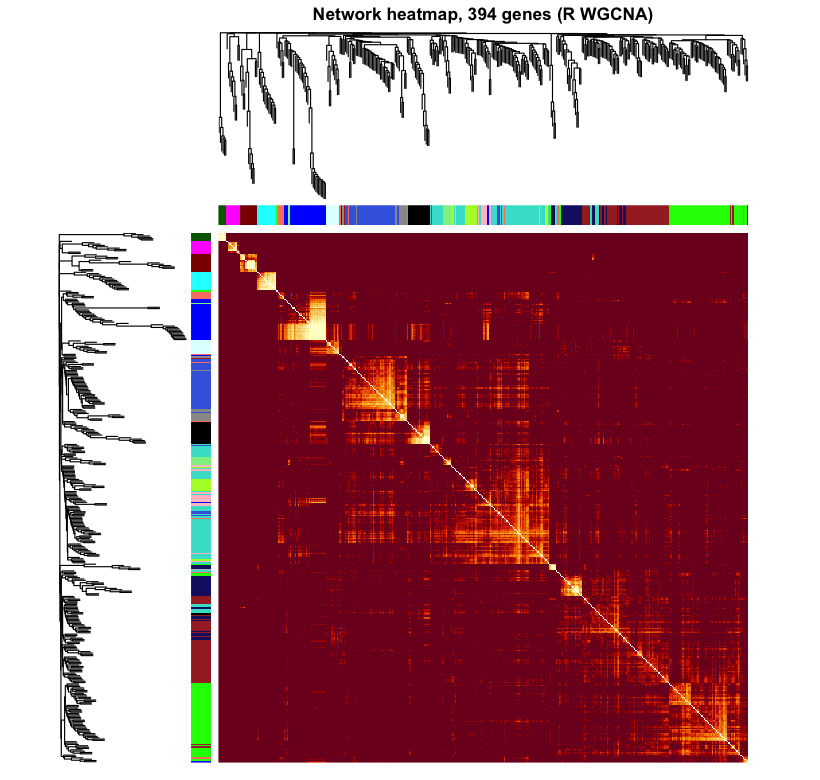
Figure 5. Network (TOM) heatmap on a 394-gene subsample, genes
ordered by module. Bright diagonal blocks are modules — sets of genes with high mutual topological
overlap (dissTOM7). The same block-diagonal structure emerges in both, with module-colour bars
on the axes.
Haritica
R WGCNA — reference
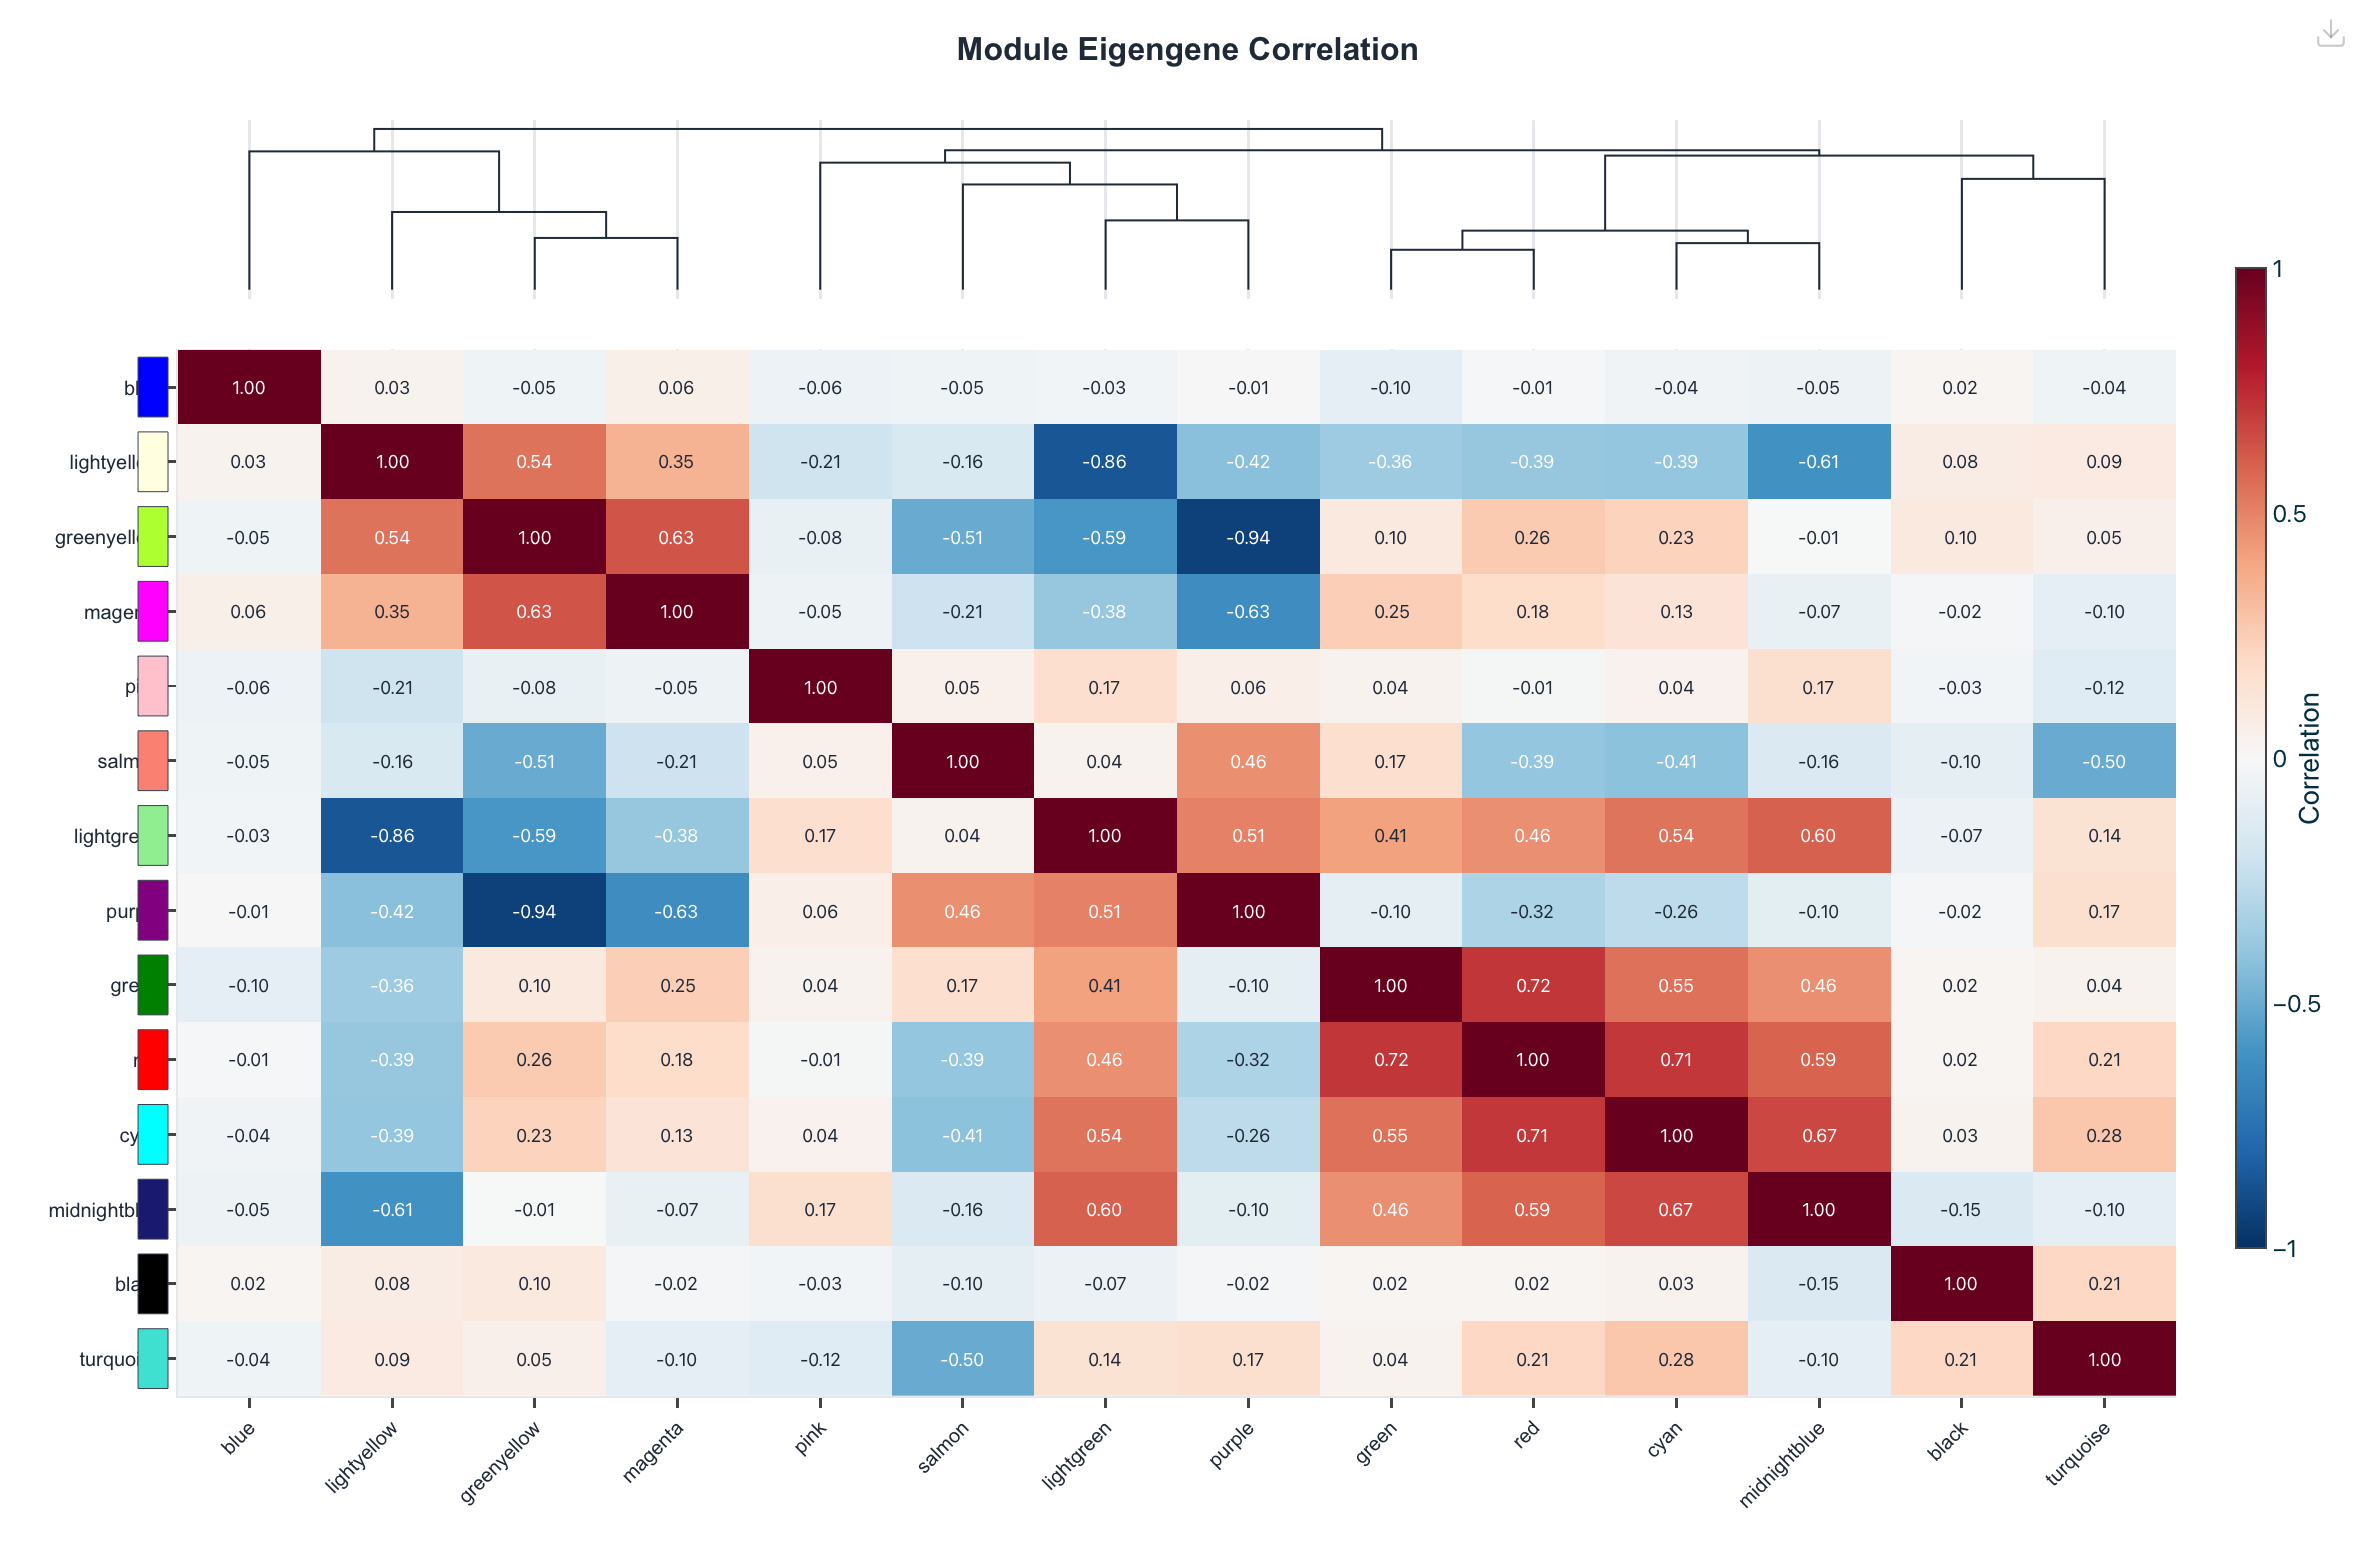
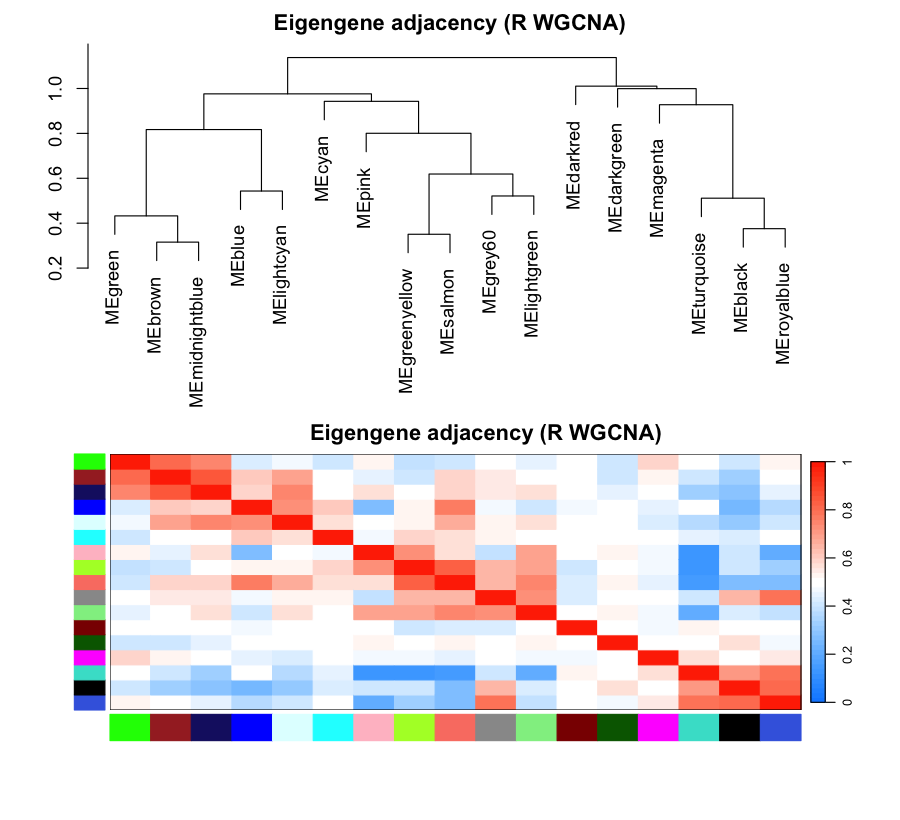
Figure 6. Eigengene network. Haritica renders the
module-eigengene correlation matrix (14×14); R renders the eigengene adjacency heatmap with its
dendrogram (plotEigengeneNetworks). Both summarise how the module eigengenes relate to one
another.
Haritica
R WGCNA — reference
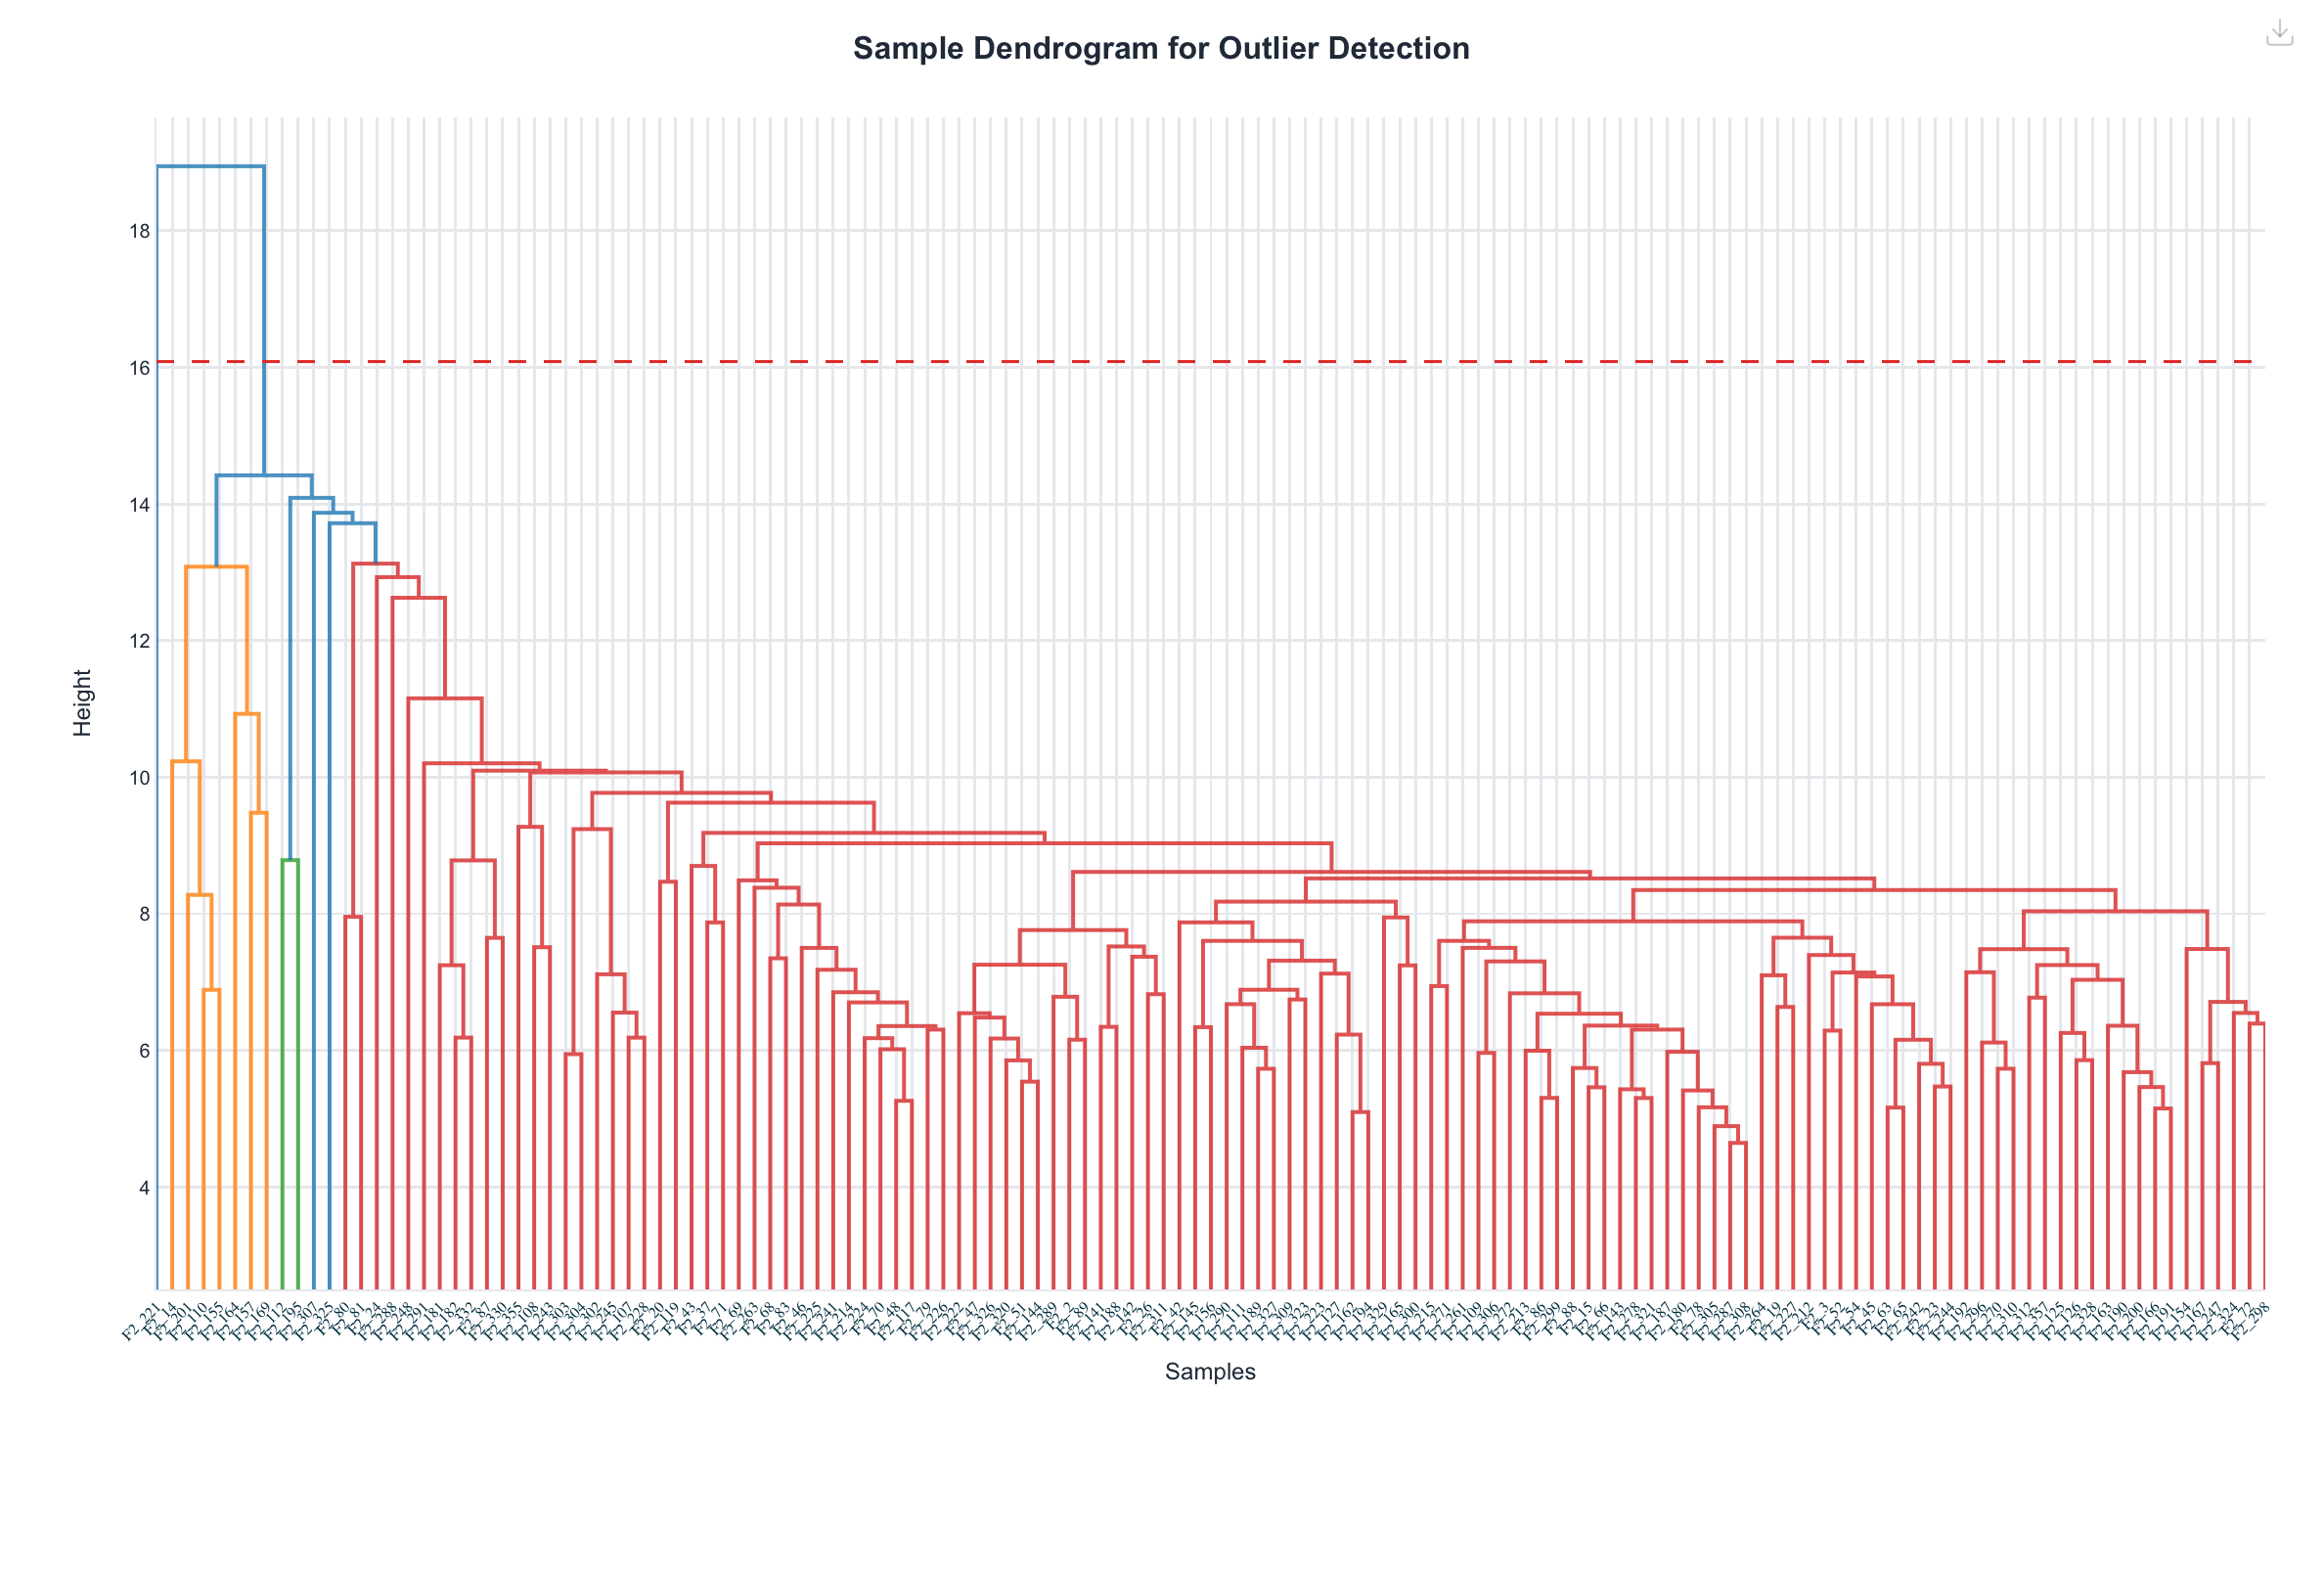
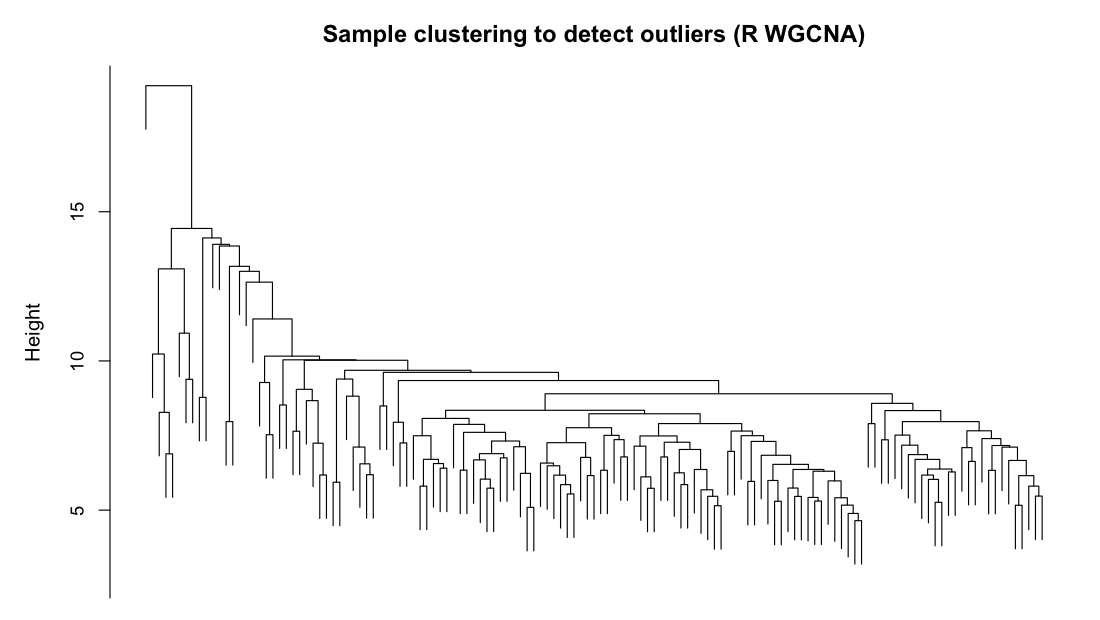
Figure 7. Sample dendrogram used to detect outlier animals before
the network is built. Both cluster the 135 samples by average linkage on Euclidean distance; Haritica
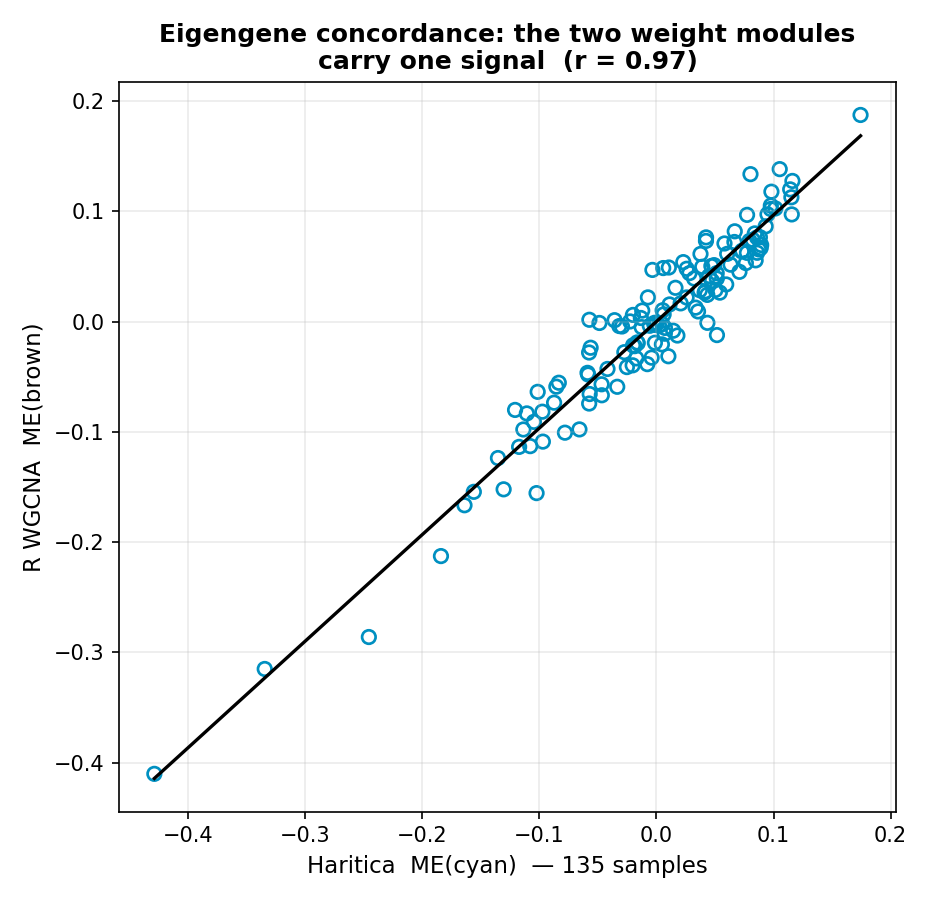
additionally draws its outlier cut line.Figure 8. Module-eigengene concordance. Each point is one mouse;
axes are the z-scored eigengenes of Haritica's cyan module and R's brown module. The two profiles track
each other across all 135 samples at r = 0.966 — the boundary-independent evidence
that the two modules represent the same co-expression signal.Figure 9. Module correspondence by gene overlap. Rows are
Haritica (PyWGCNA) modules, columns R WGCNA modules, both on the identical 3,600-gene input. Cell shade is
the overlap coefficient (shared ÷ smaller module) and numbers are shared genes. The weight
pair (cyan ↔ brown) is a reciprocal best match sharing 164 genes
(p = 7×10−94).
3Data availability and references
All inputs are public. The expression and clinical-trait matrices are the LiverFemale3600 tutorial data
distributed with the WGCNA package
(official
WGCNA tutorials), originating from the female-mouse-liver study of Ghazalpour et al. (2006 [2]).
WGCNA operates on already-quantified expression, so there is no raw sequencing input for this control. The
reference modules, eigengenes and trait correlations are produced by running the original
R WGCNA package
(Langfelder & Horvath, 2008 [1]) on the identical CSV with matched parameters; module correspondence is
established by exporting each pipeline's per-gene assignment and comparing shared membership (overlap
coefficient and hypergeometric test).
Langfelder P, Horvath S. WGCNA: an R package for weighted correlation network analysis. BMC Bioinformatics 2008;9:559.
Ghazalpour A, Doss S, Zhang B, et al. Integrating genetic and network analysis to characterize genes related to mouse weight. PLoS Genetics 2006;2(8):e130.
Rezaie N, Reese F, Mortazavi A. PyWGCNA: a Python package for weighted gene co-expression network analysis. Bioinformatics 2023;39(7):btad415.